General Explanation to My Question
I want to display a curve defined by parameter equations using a shader node tree:
$$ f(x)=\left\{ \begin{aligned} x & = f(\theta) \\ y & = g(\theta) \\ \end{aligned} \right. $$
To achieve this, I have to input a precise range of $\theta$ in the Shader Editor.
The situation
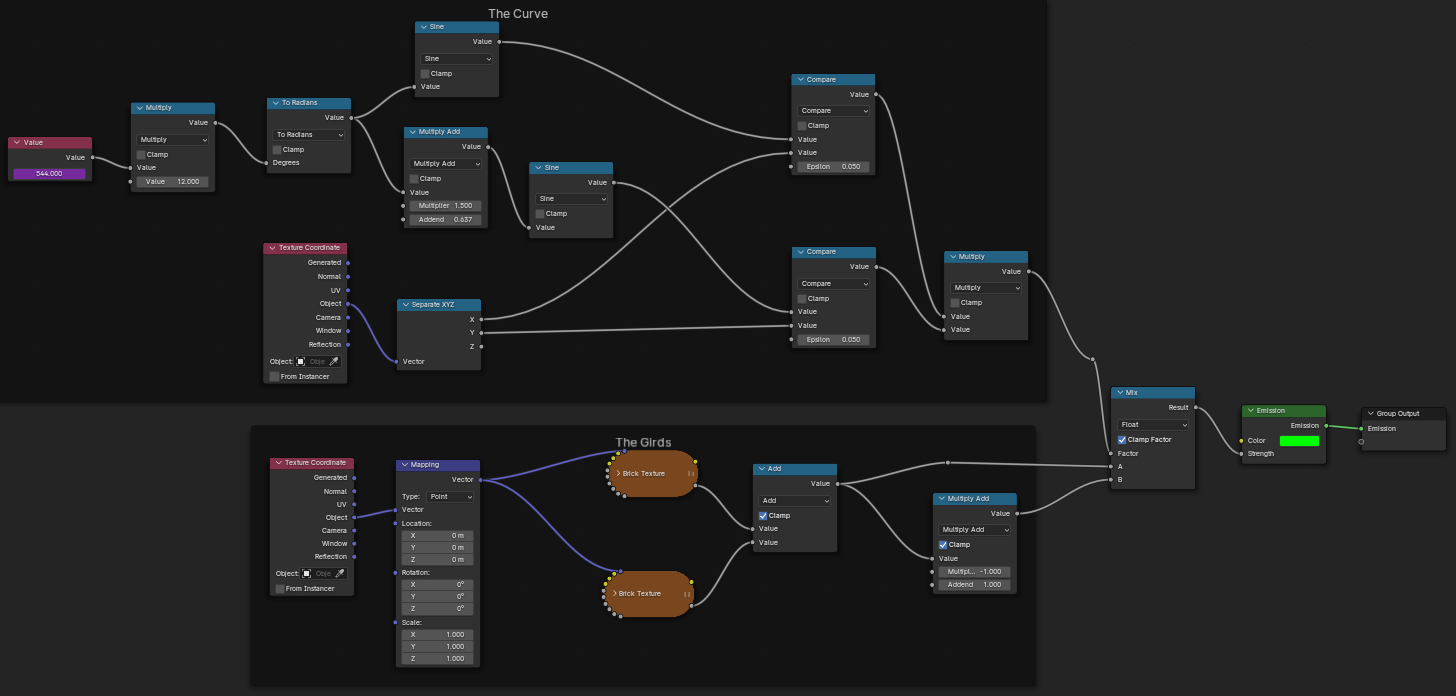
I've created something interesting: a screen that displays a Lissajous curve.
Here is how my node tree look like:

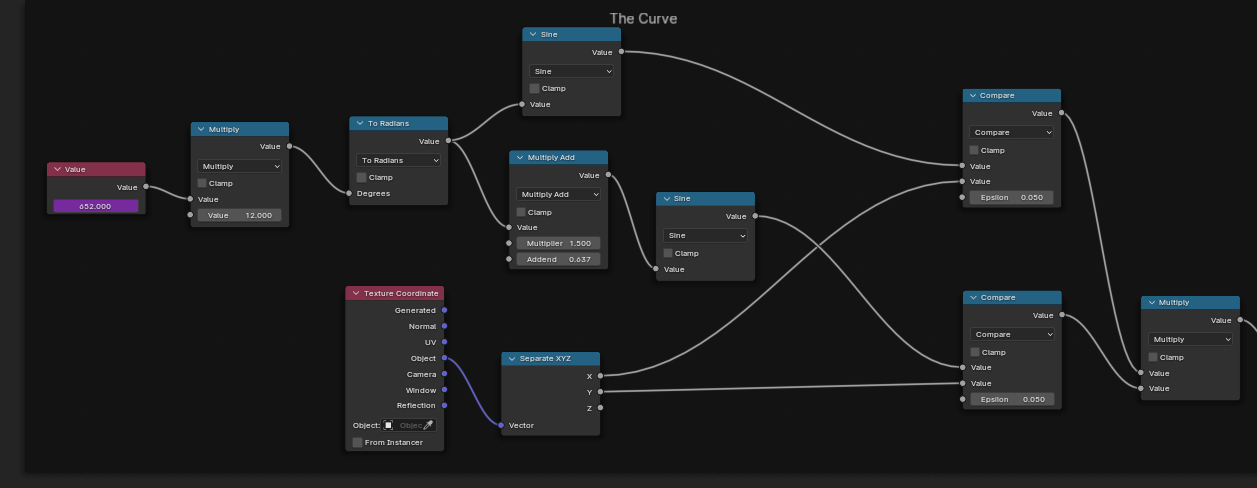
The node tree mainly comprises of 2 parts:
- the coordinate grids
- the curve (or, to be more precise, "the dot")
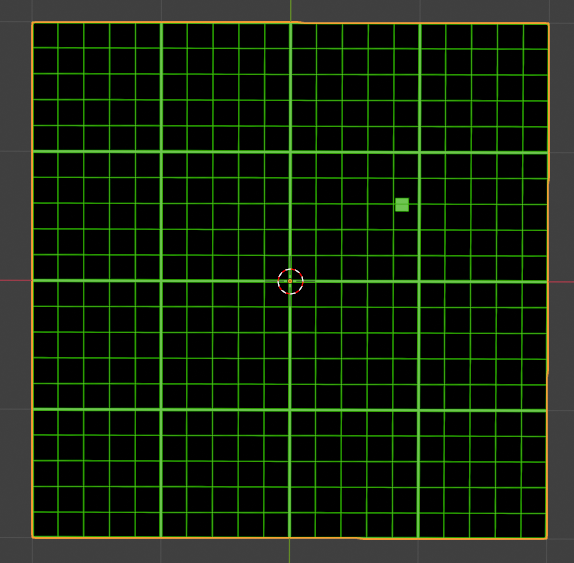
Here is what my texture looks like on a plane (2m * 2m, layed on XOY Plane) :
The question
Currently, I use a Value node which outputs #frame to change the position of the dot along with time of animation, just like a oscilloscope in the real world.

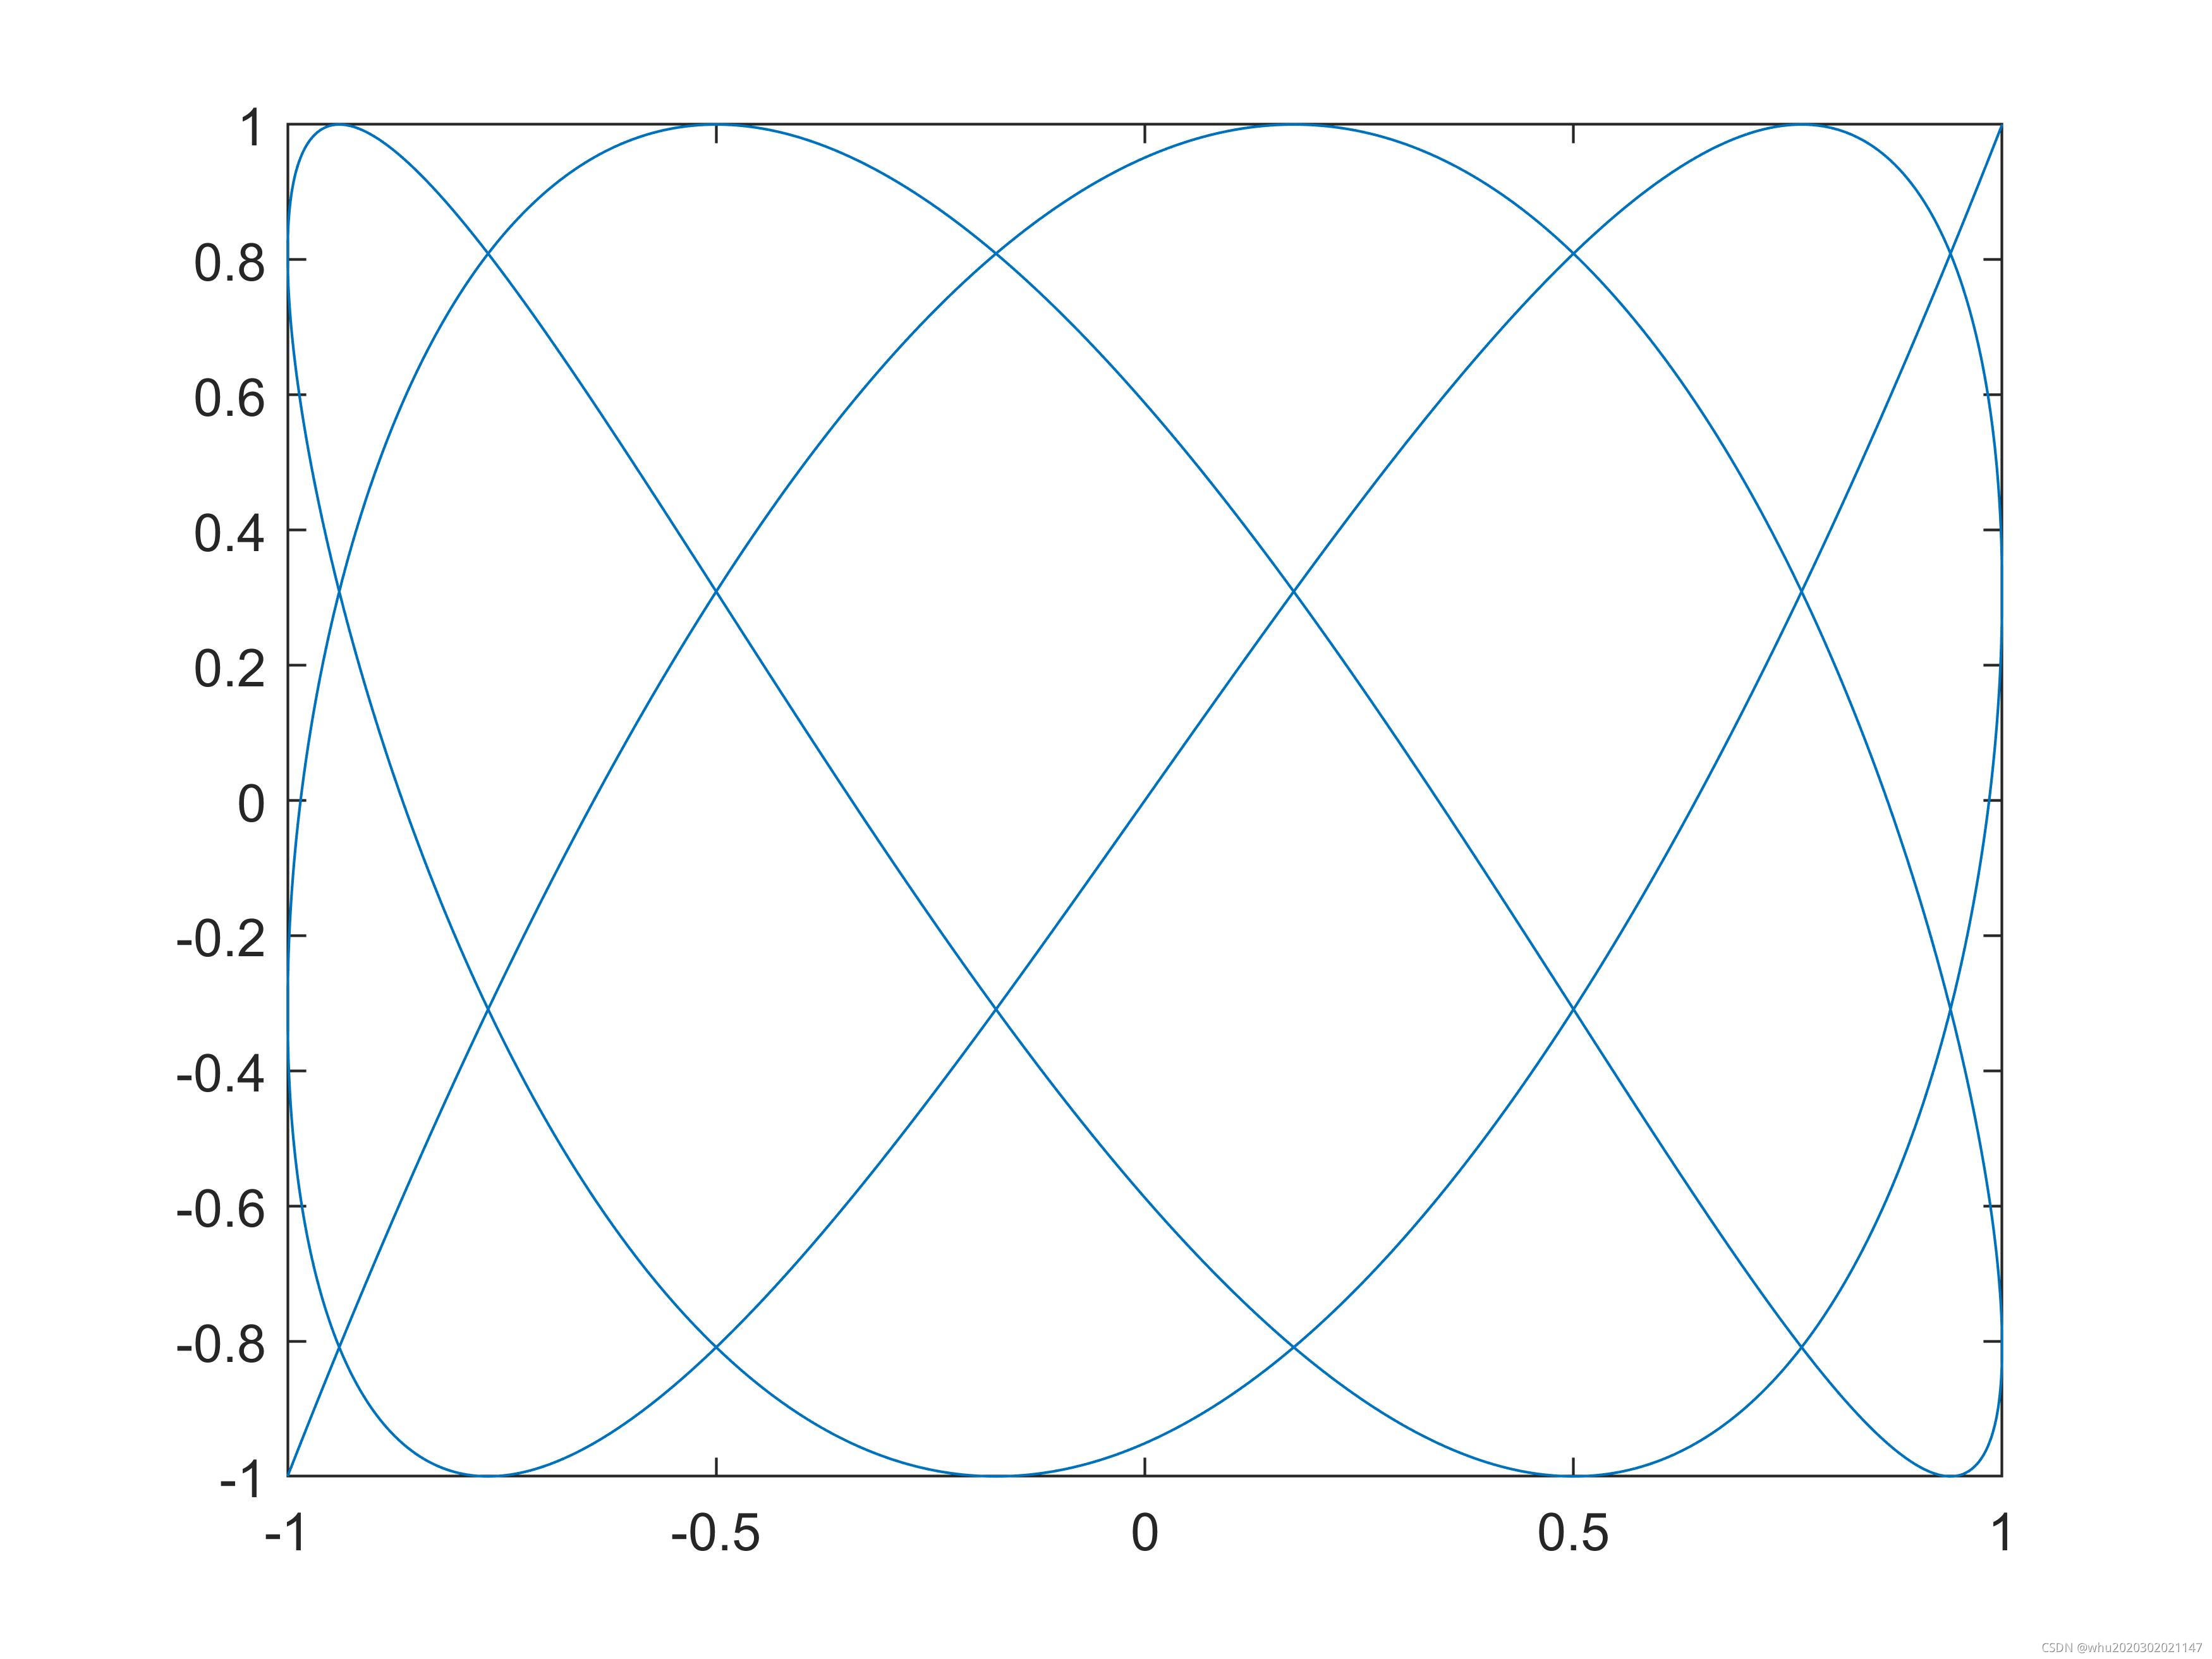
But I'd like to go furthur - I want to show the curve all at once, that is, to show the entire curve in one frame.
A common definition of Lissajous Curve is given as: $$ f(x)=\left\{ \begin{aligned} x & = \sin(\theta) \\ y & = \sin(\omega \theta + \phi) \\ \end{aligned} \right. $$
To display this, I have to input a range of $\theta$ in the Shader Editor.
And to the best of my knowledge, this is impossible unless an output node, like the Value, is capable of outputing a "continuous" value range.
Is there any way I can output a value range, or is there any workaround? Thanks a lot!


repeat zonein theShader Editor. After some search, I unterstand that therepeat zoneis a feature in theGeometry Editor, which I'm very unfamiliar with. Do you mean that I'll have to draw my plot using the Geomery Editor instead? Thank you! $\endgroup$shader Editordoesn't support iteration or repeat. Maybe I'll have to look into theGeometry Nodesor maybe turn to some Python scripts. $\endgroup$