Is it possible to create all these Lissajous curve patterns in Blender Geometry Nodes and animate them at the same time?
If yes, how? Will really appreciate any kind of help.
Is it possible to create all these Lissajous curve patterns in Blender Geometry Nodes and animate them at the same time?
If yes, how? Will really appreciate any kind of help.
There are several ways to do this, but one way would be the following:
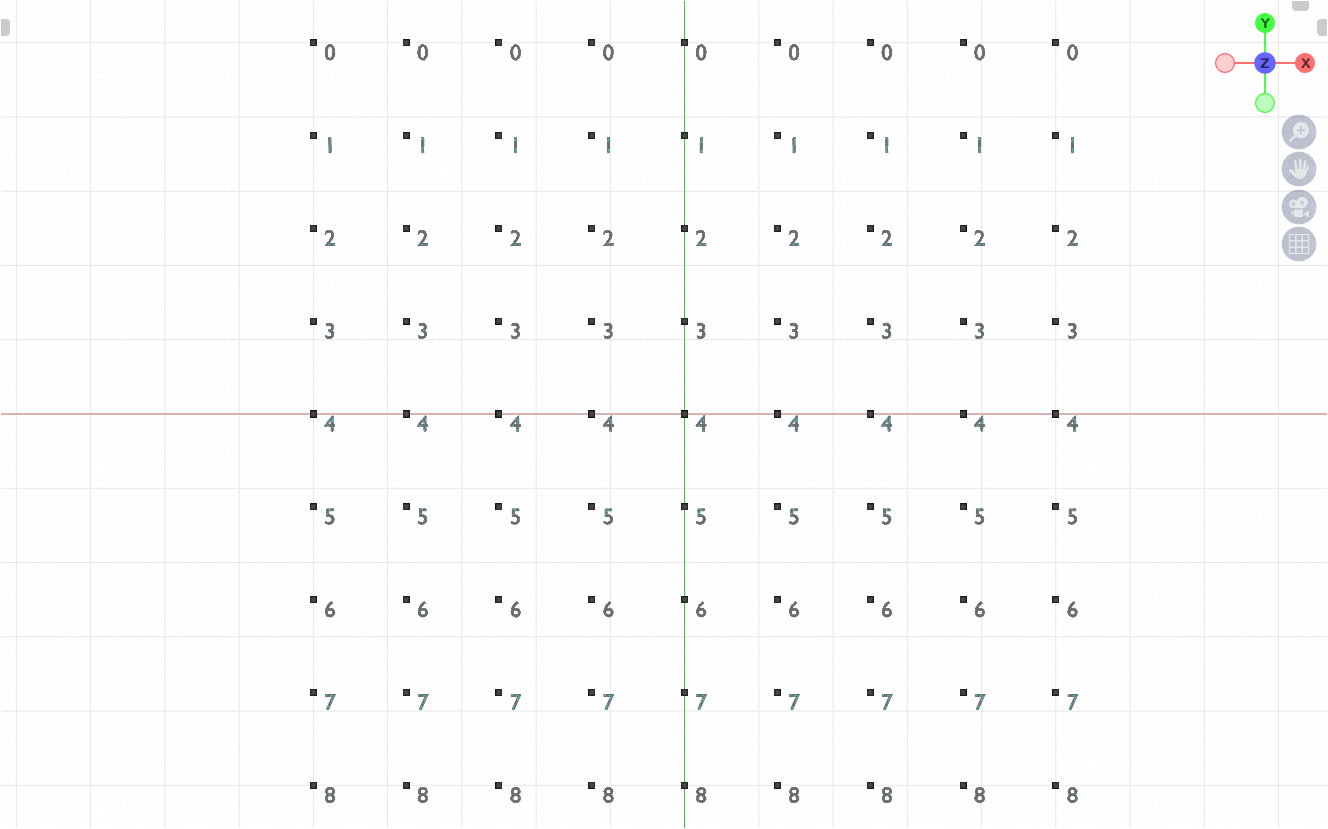
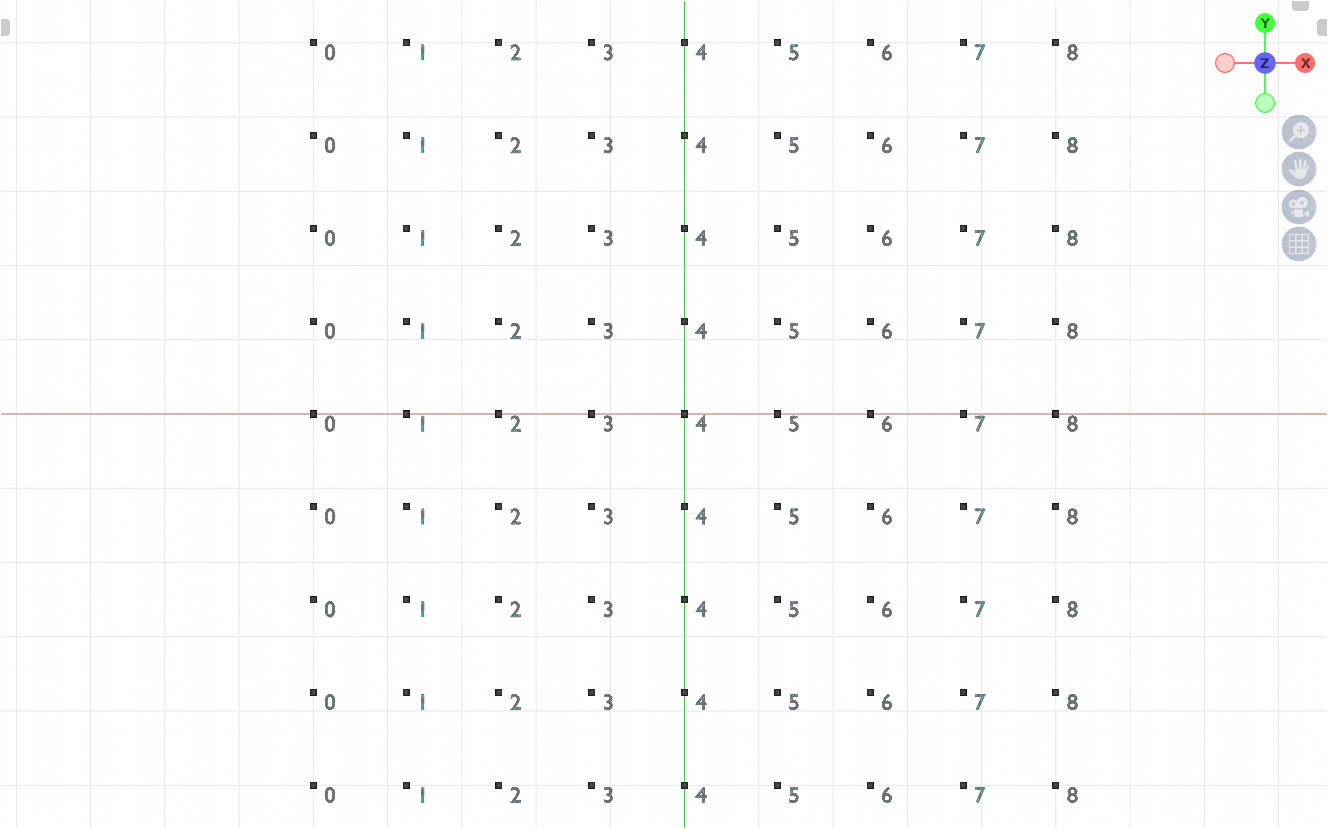
Here I use a grid as a basis, whose points I mark in advance column-wise and row-wise and multiply with a per frame incrementing value. This way I get the base values for the animation.

(The indices of the points corresponding to the rows)

(The indices of the points corresponding to the columns)
Then I instantiate circles on this grid and recalculate the positions of the circle points using the previously captured values:
In the animation it then looks like this:
Please excuse the brevity of this post, I know this isn't explained very well, but I don't have the time right now and just wanted to give you a quick example...
I might be breaking the site rules, but inspired by quellenform's answer, I created this little toy which visualizes the logic: so it's a full gantry, but instead of a crane block hanging from the beam, it just has a huge pen attached to it. The beam is on the berth, so it moves relatively to it (notice how in the setup it's moved on $y$ axis, then joined with the berth, and then together with the berth it's moved on the $x$ axis).
Now, each of the two, the berth and the beam, move in a sinusoidal pattern:
That is, when the animation starts, the beam (red on the graph) starts at the middle of the berth, goes backwards ($+y$) at full speed but slows down, and slows more and more strongly as it approaches its extreme (pen's $y = 1$), at which it fully stops and immediately reverses, accelerating more and more - until it reaches the middle of the berth it slides on, then the motion repeats in a mirrored fashion; the vertical axis above is $y$ coordinate of the pen attached to the beam (the center of the beam), and the horizontal axis is the time that has passed the energy supplied by the PSU - Power Supply Unit.
The berth moves in the same way, except it moves on the $x$ axis (the vertical axis on the graph is $x$) and it starts at its rightmost extreme - so the graph is shifted (blue).
Obviously the red line shown on the graph is sine, and the shifted blue pattern is cosine. Here's the mentioned movements (marked orange) and their combination (marked yellow):
The reason why I decided to call the horizontal axis of the graph the "energy supplied" rather than just time passed, is that there is only one global time, but I can have independent Power Supply Units - one for the berth and one for the beam; that's how the animation above was done, the left object had beam PSU set to $0$, and the right had berth PSU set to $0$. But what if both elements are supplied with power, but at different intensities?
It doesn't look as neat as in quellenform's answer or in the question, because I modified it while it was running, now I'll do so prior to playing the animation:
Of course being able to modify the power supply during the animation opens new possibilities, e.g. berth PSU = tau / 100 and beam PSU = #tau/100 * (fmod(frame, 100) < 25):