1
$\begingroup$

I’m working on a VR data viz project. I want to view a lot of data (population data in this example), but the data is too voluminous to be viewed all at once. I’m currently exploring a concept where the number of data points displayed is proportional to the viewer distance from the map, so that as you move away from the map the smaller values are aggregated to reduce the number of data points (and vice versa). Here is the effect I’m going for, where as you move in closer to the map you get to see more and more details (except I want the values to actually be aggregated instead of just hiding the smaller ones):

Text

I’m having trouble figuring out how to do the aggregation. I’ve got a node setup that aggregates multiple object volumes into a single volume, but it only works on a collection (where my data was loaded from a csv file into a single object containing all the data points).

Text Text

But my real problem is how to selectively pick the data points to aggregate. I tried to use a proximity node but I couldn’t get that work, so I switched to a Voronoi where the centers of each Voronoi island are the largest values, and I can control the density of the Voronoi by hiding data points that are smaller than a selected value. What I want to do is select all the other values in the island and add them into the center bar. But I cannot figure out how to select the bars to add using the Voronoi as the mask.

Text Text

CSV file (I used the spreadsheet importer and only imported the X,Y,Pop columns) CSV file for population data

$\endgroup$
3
  • $\begingroup$ Can you possibly share your CSV file as well? $\endgroup$
    – Jakemoyo
    Commented Jul 10 at 19:15
  • $\begingroup$ @Jakemoyo: the data are accessible in the blend file via attributes. So i don't think there is a need for a csv file.... $\endgroup$
    – Chris
    Commented Jul 11 at 6:56
  • $\begingroup$ @Jakemoyo I added the CSV file just in case its helpful $\endgroup$
    – BrianM
    Commented Jul 12 at 15:14

2 Answers 2

2
$\begingroup$

(Using Blender 3.6.12)

NB: The proposed approach does not rely on the Voronoi partitioning to aggregate the population (because it seems a workaround), but on a Sample Nearest strategy (because it is more straightforward).

Results

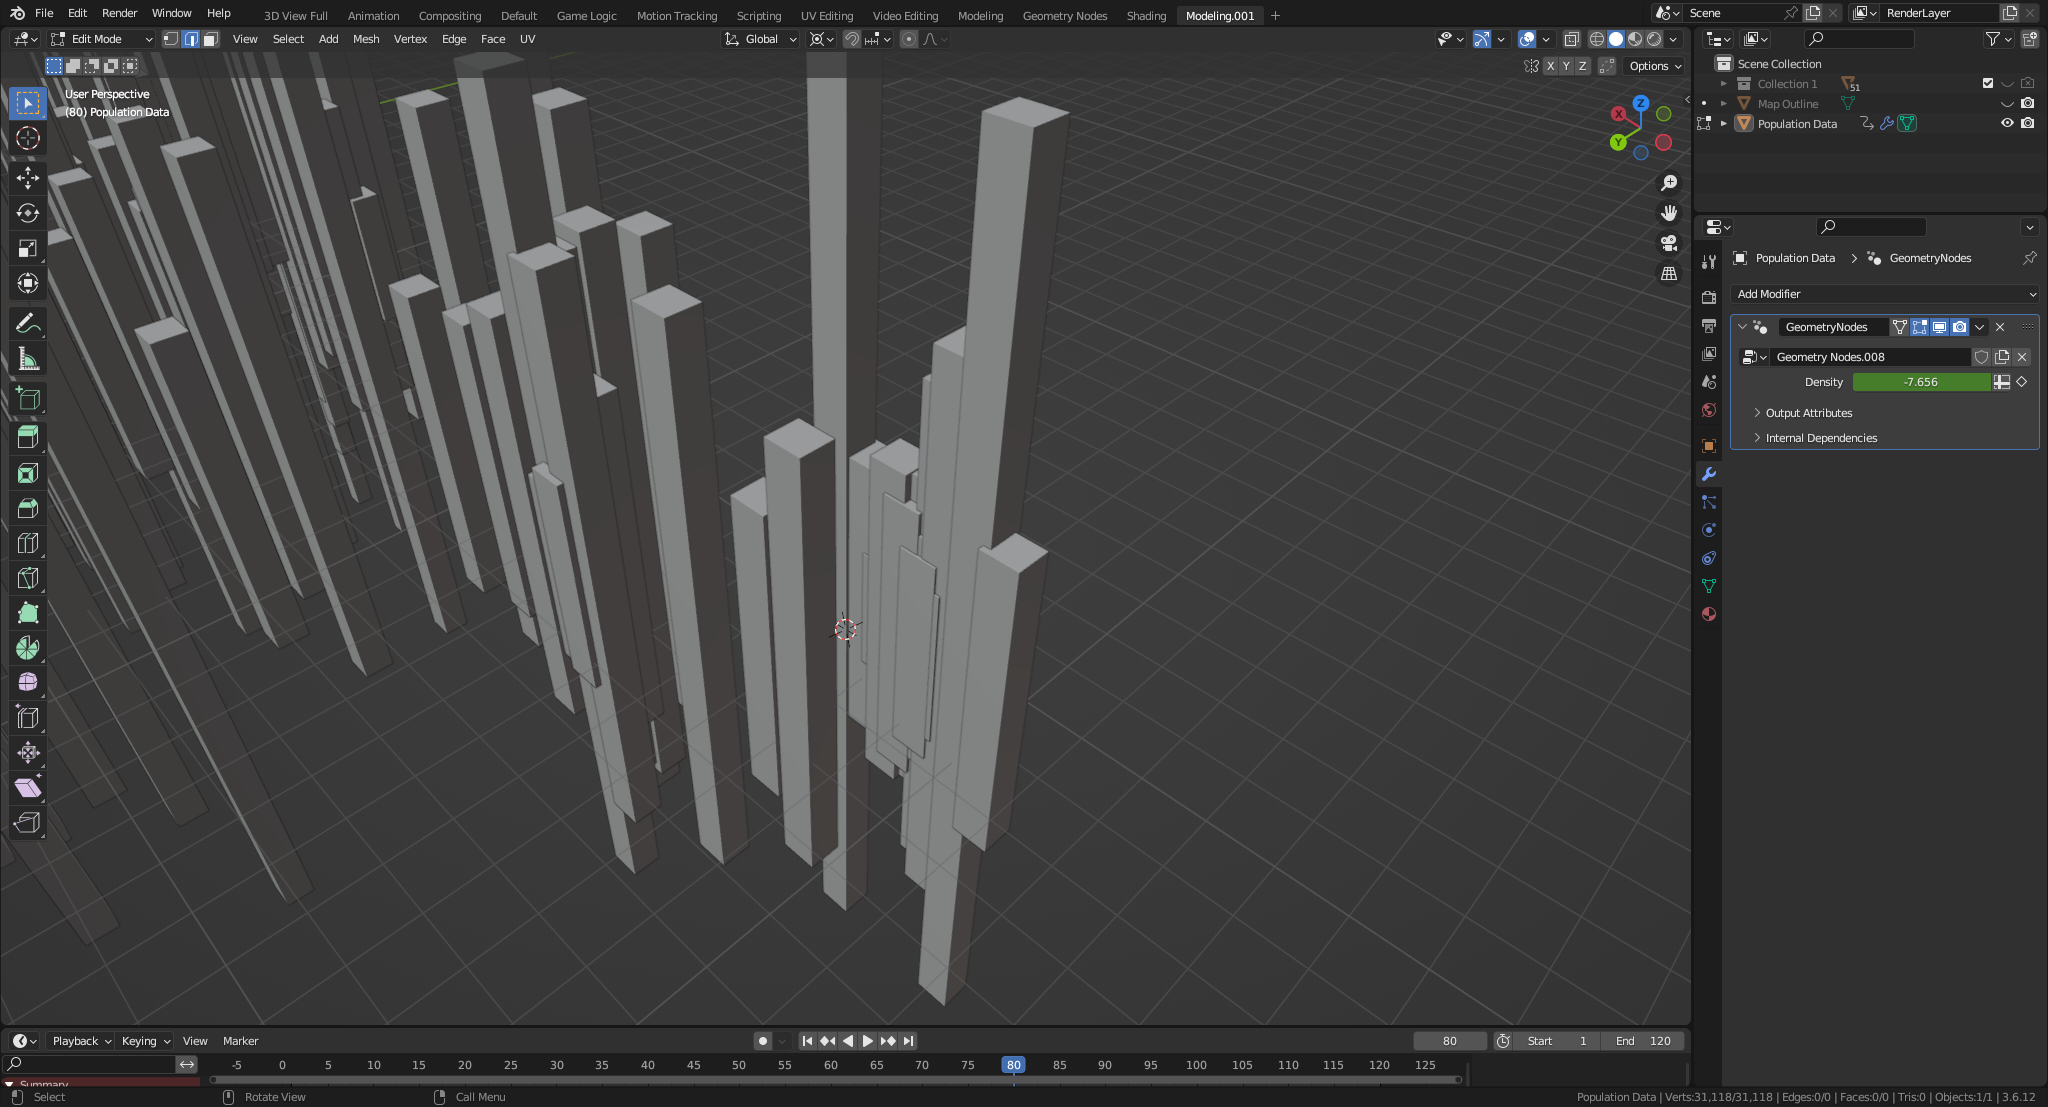
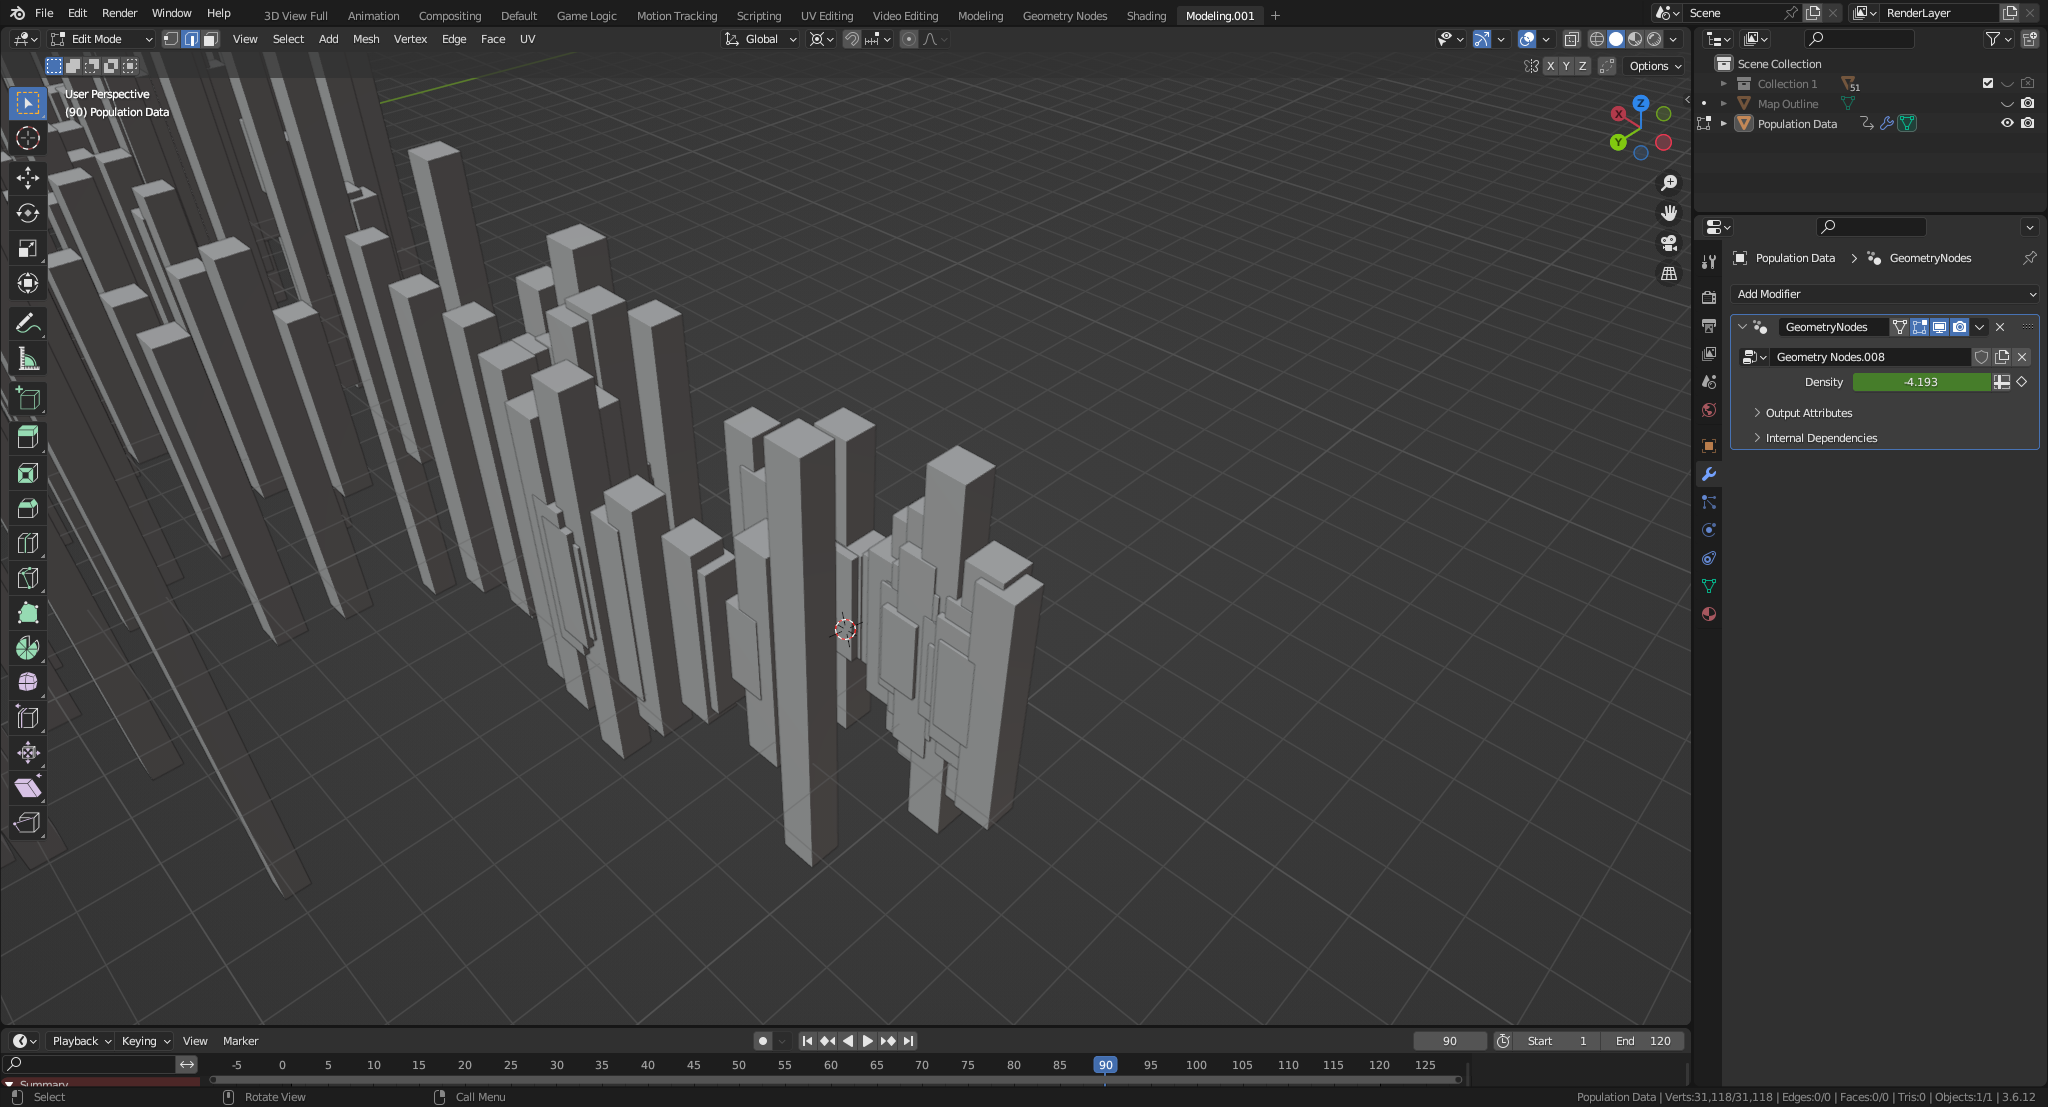
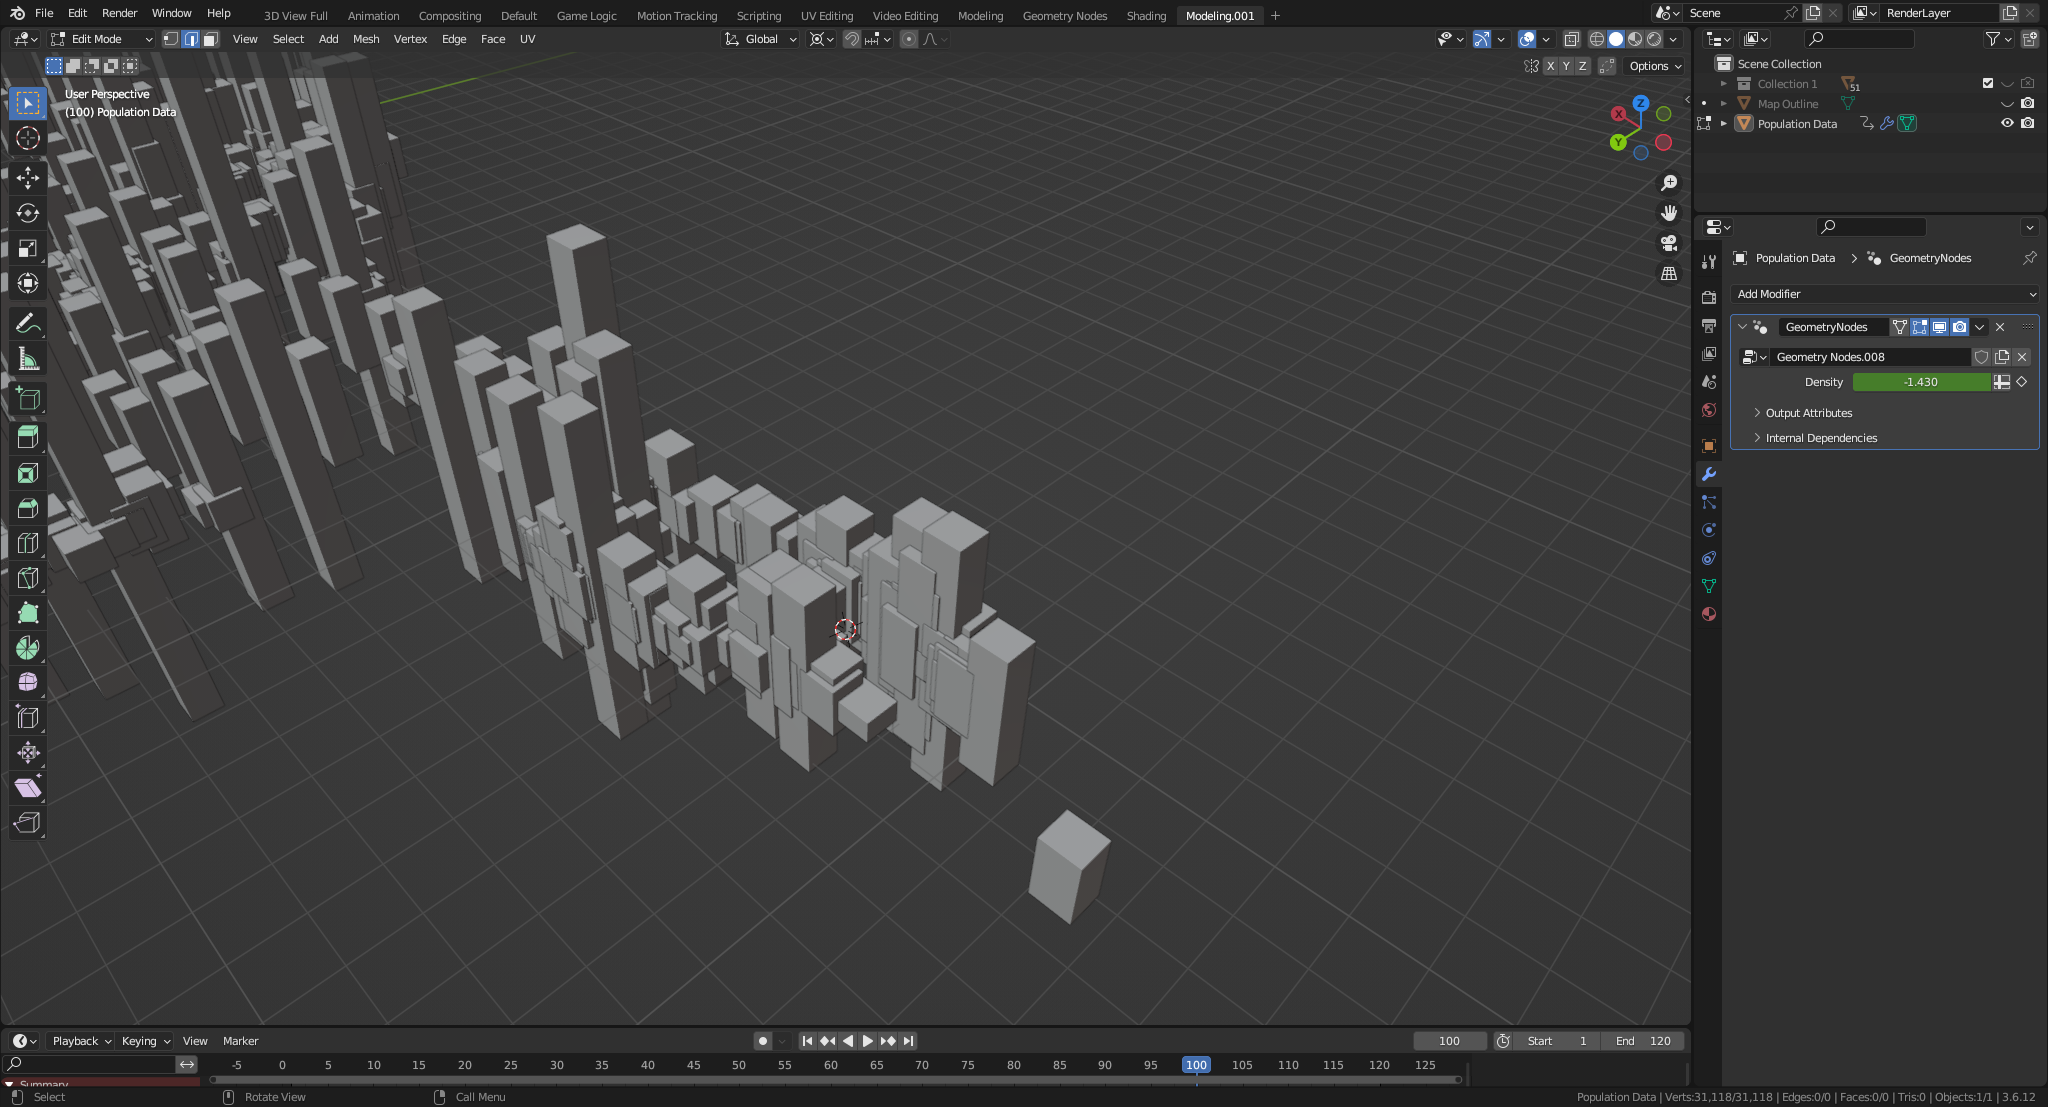
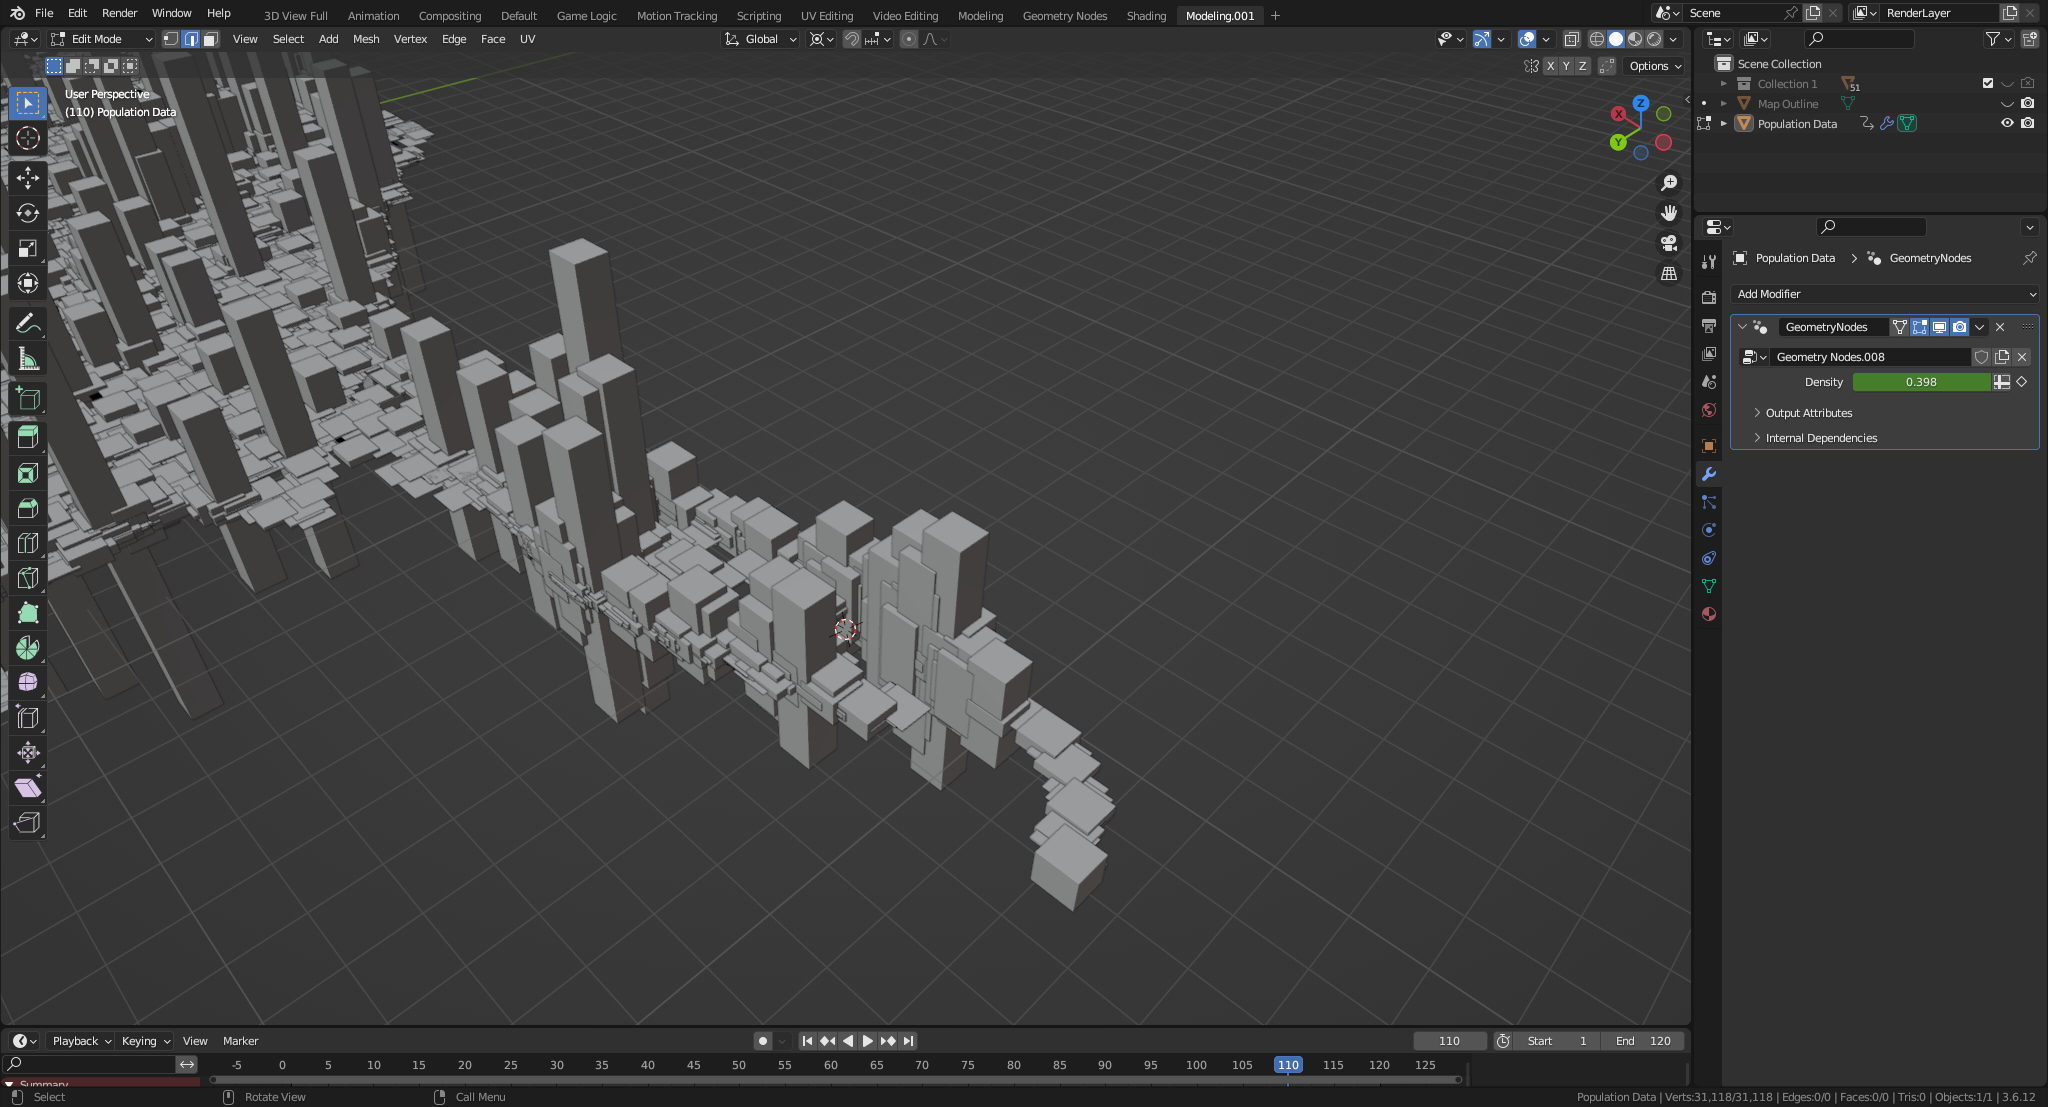
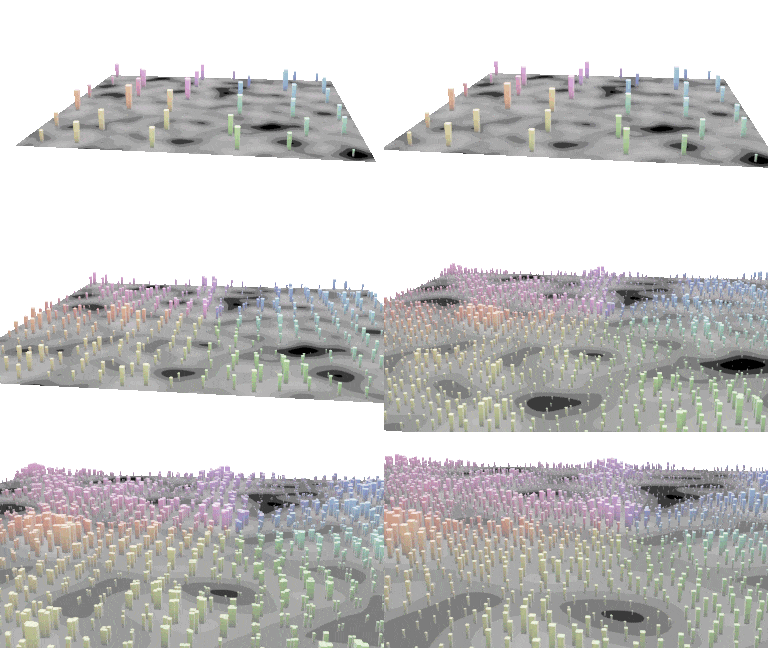
The following snapshots illustrate the achieved animation for Florida when the user-defined Density parameter increases with the frame number.

after 80 frames after 90 frames after 100 frames after 110 frames

GeometryNodes Modifier

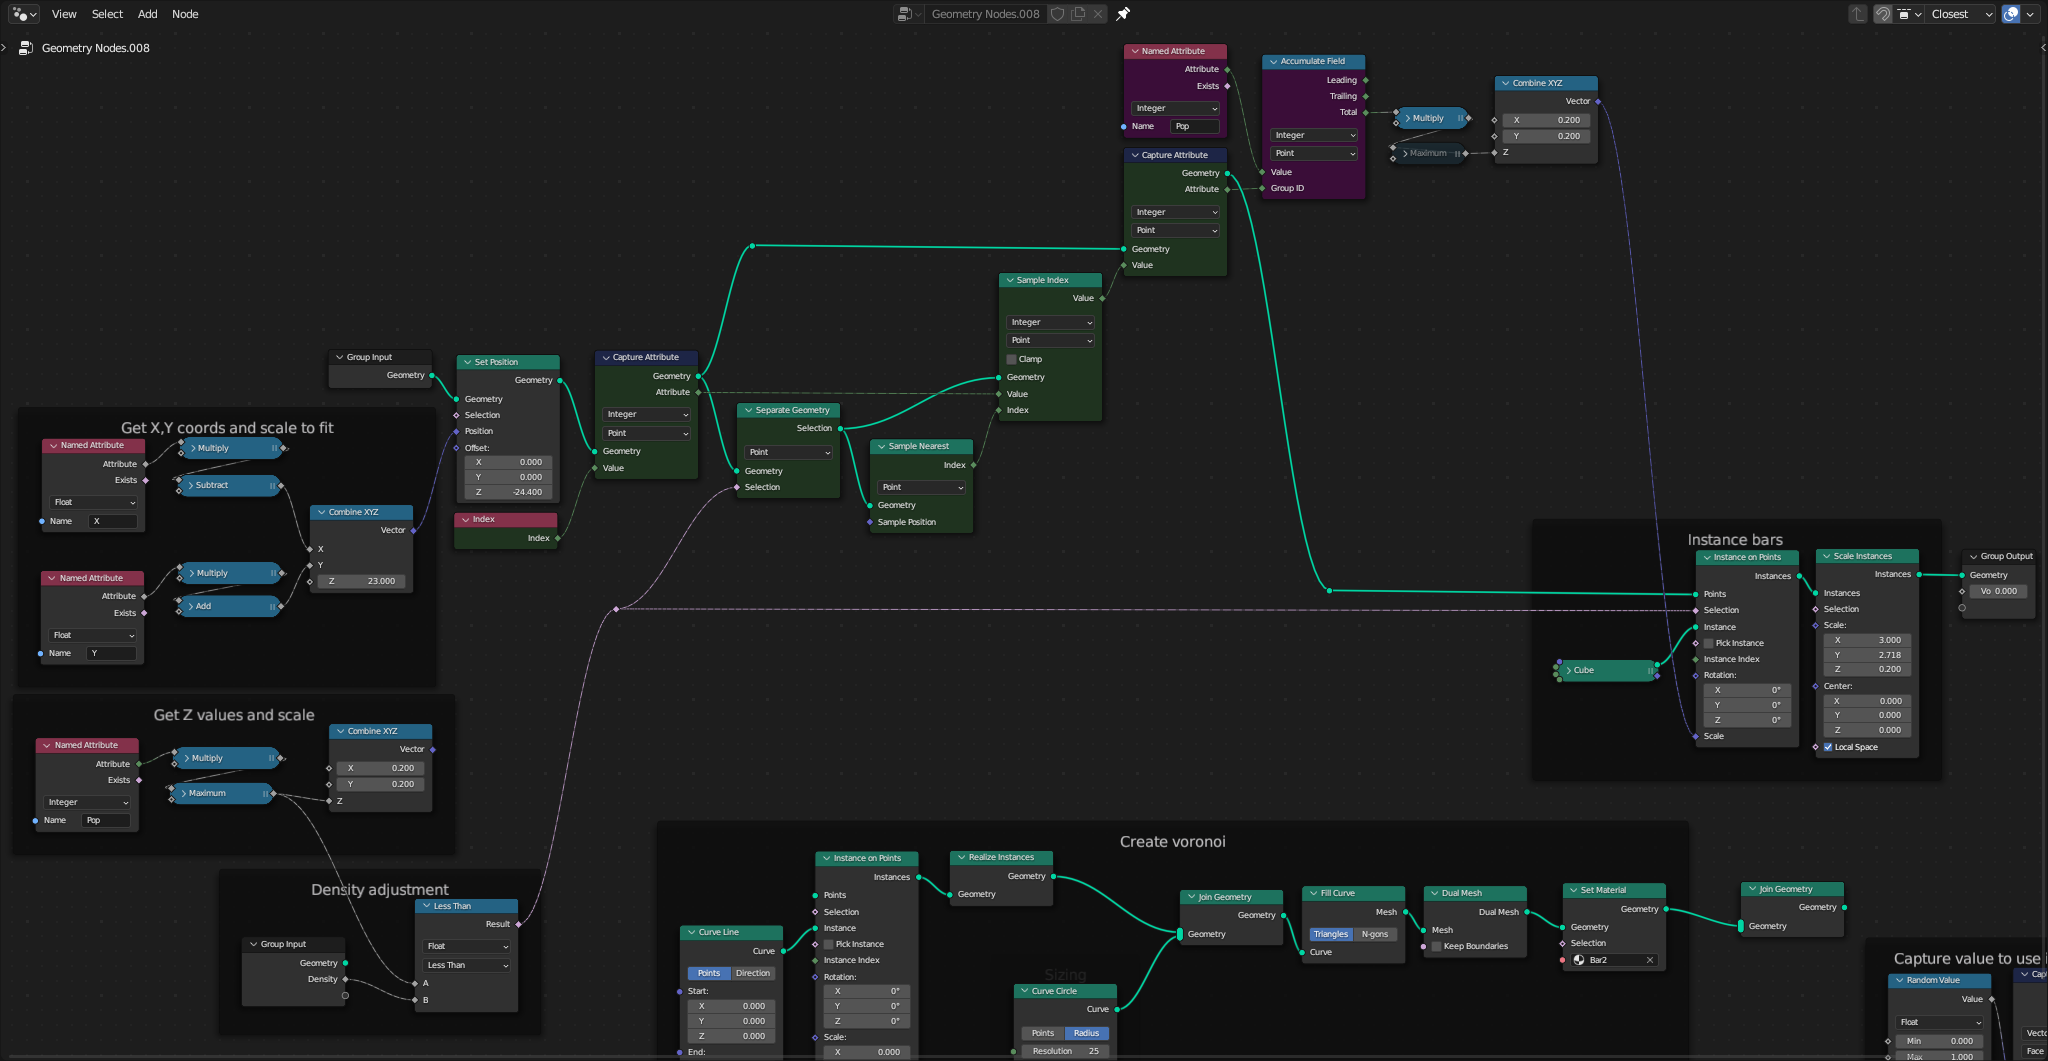
GN Graph Green nodes: The vertices to aggregate on are isolated using a Separate Geometry node connected to the Density adjustment selection mask. This subset is input in a Sample Nearest node followed by a Sample Index node to capture the Index of the selected vertices to aggregate on (see Sample Nearest Node documentation).
Pink nodes: This captured Index is used as Group ID to accumulate the Pop Named Attribute in "bins", one per selected vertex.

Resources:


(Blender 3.6.12+)

$\endgroup$
1
  • $\begingroup$ This is great! Thanks for the help. I can use this straight away for what I need now while I work my brain up to the boss level shit @Markus von Broady posted. $\endgroup$
    – BrianM
    Commented Jul 12 at 20:37
2
$\begingroup$

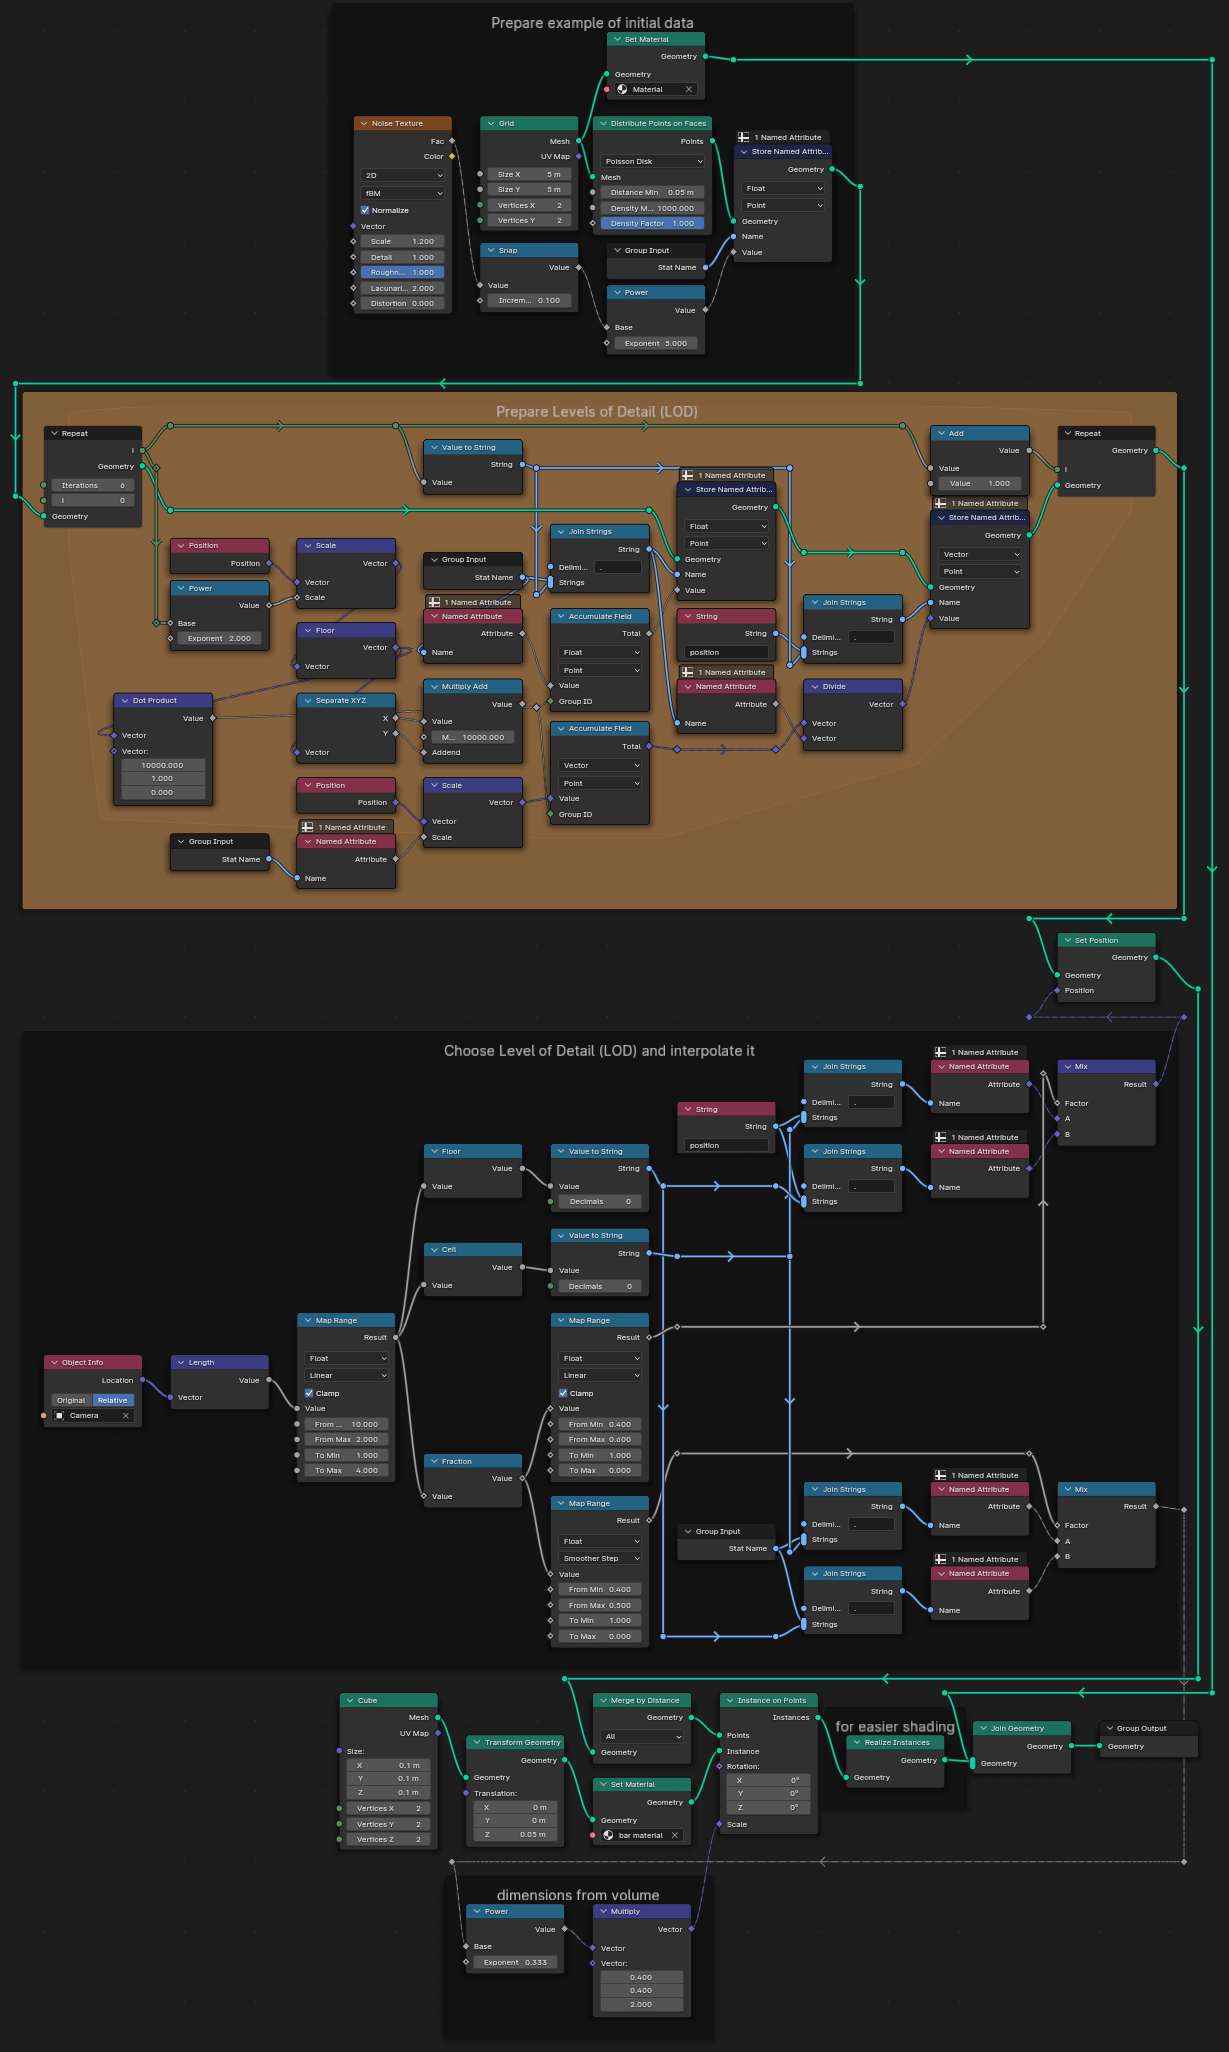
This solution groups the datapoints together using a grid with cell size depending on the distance to camera. In order to be able to animate and make transitions smooth, the grid is dynamically subdivided (hence raising $2$ to a power as a coordinate multiplier) as opposed to just scaling the cell size linearly.

You could replace this grouping logic with any other, e.g. you could store group info as an integer, which changes depending on zoom level: first a continent, then a country, then a region of that country, then a city etc.

The points in each group are merged similarly to how "Merge by Instance" works, except here the merging is weighted - a heavy point doesn't move as much as a light point.

Merging is done simply by overlapping. The distances are morphed through 20% of the distance change (between 40% and 60% of the transition), so that for the most time stuff doesn't move and actual data can be observed. The scales are morphed much faster, using first 50% of the former range and "Smoother Step" to give more natural look of splitting.

The intermediary steps are precalculated in a repeat zone, so you can bake it afterwards to optimize your setup if it has a lot of points...

$\endgroup$
2
  • 1
    $\begingroup$ Looks pretty pro dawg. $\endgroup$
    – Jakemoyo
    Commented Jul 12 at 17:24
  • 1
    $\begingroup$ This is awesome! I need some time to decipher all this, but this is definitely the effect I was going for! $\endgroup$
    – BrianM
    Commented Jul 12 at 19:36

You must log in to answer this question.

Not the answer you're looking for? Browse other questions tagged .