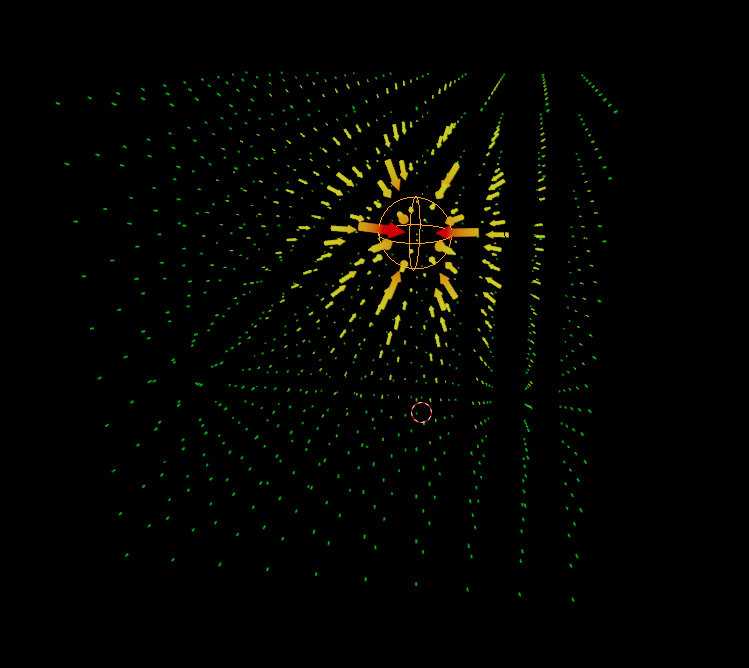
You could use mesh arrows to do it.
First, you need to create an arrow and the object that controls the field (in my case an empty named CTRL), then add a Track To constraint that points to the control.
Then you'll need to create your grid, which can do using this script:
import bpy
from bpy.app.handlers import persistent

dim = 10   #number of arrows on an edge og the cubic grid
spacing = 1
ctrl = bpy.data.objects["CTRL"]     #the control object
maxScale = 0.2
minScale = 0.01
distRange = 5

obj = bpy.context.selected_objects[0]

parent_coll = bpy.context.selected_objects[0].users_collection[0]
coll = bpy.data.collections.new("Grid")
parent_coll.children.link(coll)
for i in range(dim):
    for j in range(dim):
        for k in range(dim):
            new_obj = obj.copy()
            #new_obj.data = obj.data.copy()
            new_obj.animation_data_clear()
            coll.objects.link(new_obj)
            new_obj.location = ((i-dim/2)*spacing, (j-dim/2)*spacing, (k-dim/2)*spacing)  #define arrows positions (here they are centered on the world origin)

            #add drivers on the scale
            for t in range(3):
                driv = new_obj.driver_add("scale", t).driver
                driv.type = 'SCRIPTED'
                driv.use_self = True

                dist = driv.variables.new()
                dist.name = "ctrlName"
                dist.type = 'SINGLE_PROP'
                dist.targets[0].id = ctrl
                dist.targets[0].data_path = "name"

                driv.expression = "getScale(ctrlName, self, "+str(maxScale)+","+str(minScale)+","+str(distRange)+")"


def getScale(ctrlName, obj, maxScale, minScale, distRange):
    ctrl = bpy.data.objects[ctrlName]
    dist = getDistance(ctrl, obj)
    power = ctrl.scale[0]
    scaleRange = maxScale - minScale
    dist = dist/power   #distance is affected by the control size as well

    if dist > distRange:
        scale = minScale
    else:
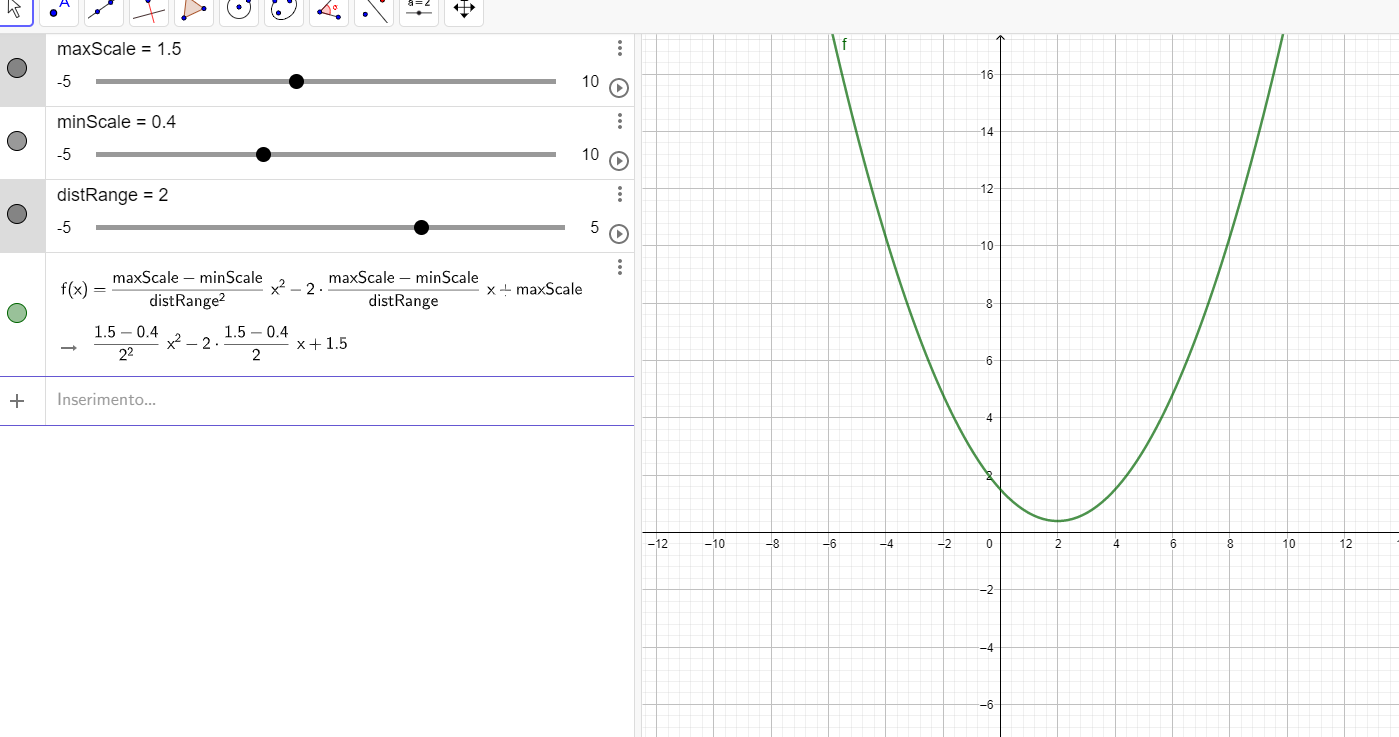
        scale = scaleRange/(distRange**2)*(dist**2) - 2*scaleRange/distRange*dist + maxScale    #Here you define your scale function

    return scale

def getDistance(ctrl, obj):
    sum = 0
    for i in range(3):
        sum += (ctrl.location[i] - obj.location[i])**2
    return sum**0.5

bpy.app.driver_namespace['getScale'] = getScale
The first part takes care of duplicating the arrows on the grid. As you can see, at the top there are some parameters you can change without going too much into the code.
The second part of the script creates and runs the drivers that control the scale of the arrows: it's a function that takes some of the parameters at the top of the script and calculates the scale of every single arrow. I strongly suggest you to check and modify the function to fit your needs, expecially if you are working on a scientific project.
The way I set it up is using a normal quadratic interpolation:

this is not very good looking, but you'll have the pick the interpolation you prefer. Also, note that in the script the size of the control affects the field as well.
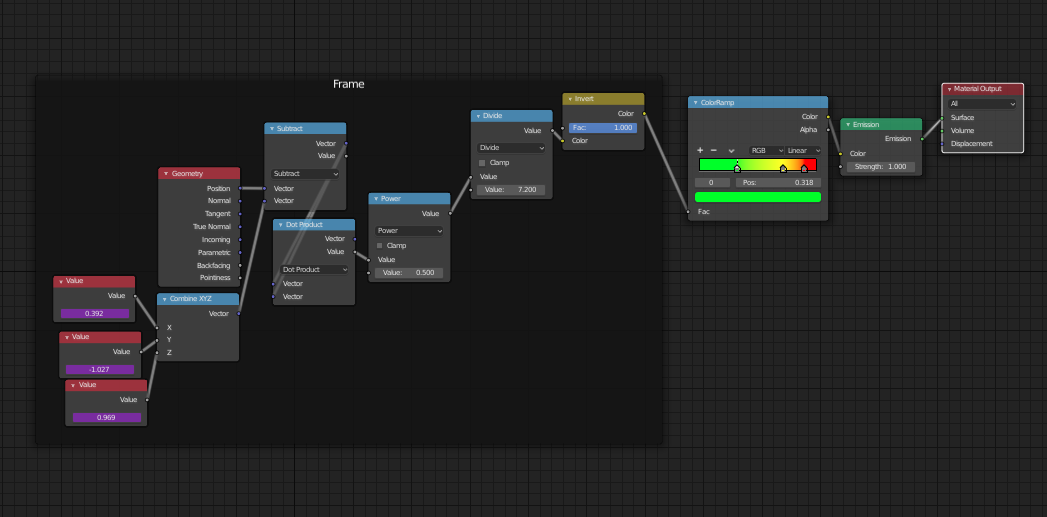
For the color, there is just one material that calculates the distance between each arrow and the control (the control's position is gathered with 3 drivers) and feeds it in a ColorRamp

This is the final result with the download link of the project:


There are many things that can be changed or improved, but I stopped here because this might be enough for you. Possible changes could be a different interpolation function for the scale or the color (because right now they work on a 2 different interpolations, but it's possible to join them together); some custom properties to store the parameters in the GUI, so that you don't have to run the script again every time you make a change; you could want to change only the length of the arrow instead of all 3 dimensions; etc...
After an extensive correspondence we came up with a broader solution, available on Github at https://github.com/Hilicot/Blender-Field-Generator


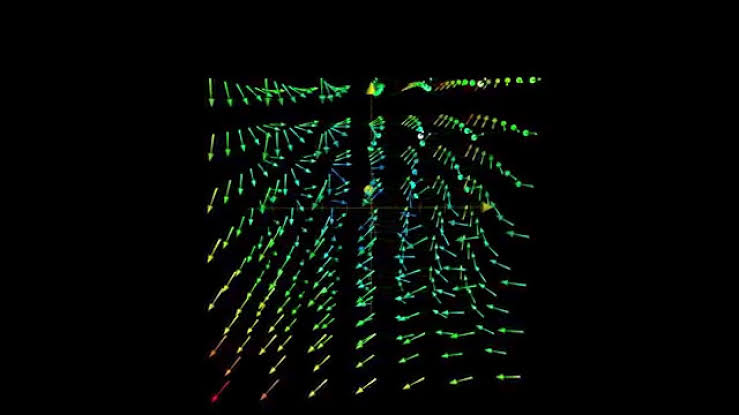
text editor > templates > python > gizmo simplewhich displays an arrow gizmo to control the intensity of a spot lamp when selected. The color and orientation of the gizmo arrow can be set. This will display on 3d view as in image, but not be renderable, or animated using standard keyframing or drivers. A point cloud mesh (verts only) could be used for positions, and vertex color layer (rgba) for magnitude and direction of vector. $\endgroup$bglto draw arrows. Similarly to normals overlay $\endgroup$