1
$\begingroup$

let me just preface this by saying I am new to Blender and have a very minimal knowledge pf it as of now. The problem happened as I was following along with a tutorial and while doing a cloth simulation, I was getting about 0.4 fps (this was my first time running an animation), I checked blender's usage of system resources via task manager and everything was under utilised, with blender using memory 6-7%, cpu 8-12%, gpu 2-4% and no other major applications running. I have looked for ways to make it use more of these resources but couldn't find any that made much difference, I did in the end get it to 2 fps but that was due to a post that said scaling small objects up makes blender process the simulation better. I am hoping someone here can tell me how to optimize blender to better use these resources. I am running the animation in viewport and solid shading, this isn't with regards to rendering speeds although even then the system resources remain under-utilised.

My specs:

Dell XPS 15 9560 | Windows 10 v. 1909 64-bit

GPU - Nvidia GeForce GTX 1050

CPU - Intel Core I&-7700HQ @ 2.80Ghz (8-core)

RAM - 32 GB

Please let me know if the information is incomplete.

$\endgroup$
3
  • 1
    $\begingroup$ You did not mention anything about your GPU drivers. Are they up to date? Old drivers is by far the most common cause of problems in Blender. $\endgroup$ Commented May 2, 2020 at 14:54
  • $\begingroup$ Yeah they are up to date, the comments under stphnl329's answer contains a lot of troubleshooting, conclusion seems to be that the cpu is being capped by the system at 28% causing issues, if you know any solutions please let me know. $\endgroup$
    – EdenWulffe
    Commented May 2, 2020 at 20:55
  • $\begingroup$ I’m voting to close this question because the issue was inaccurate reporting of CPU usage by the Windows Task Manager. $\endgroup$
    – stphnl329
    Commented May 2, 2020 at 21:27

1 Answer 1

4
$\begingroup$

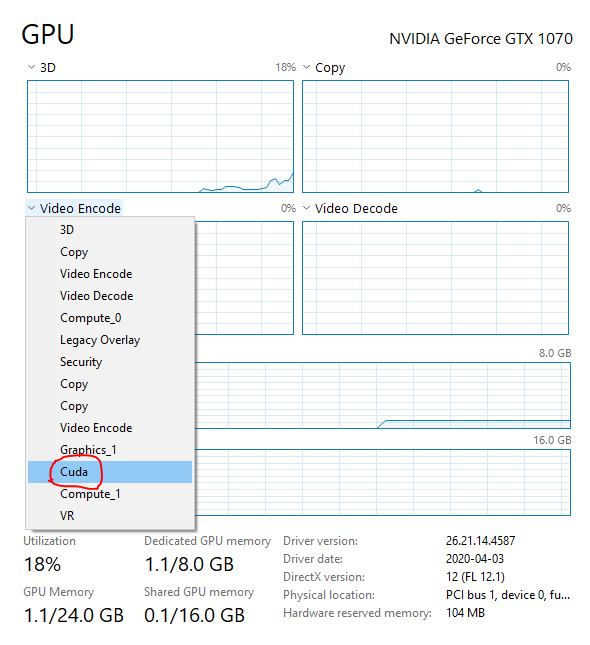
Blender most likely is fully using your system resources. In the task manager, change one of the charts to display CUDA and you'll see that its being fully utilized.

enter image description here

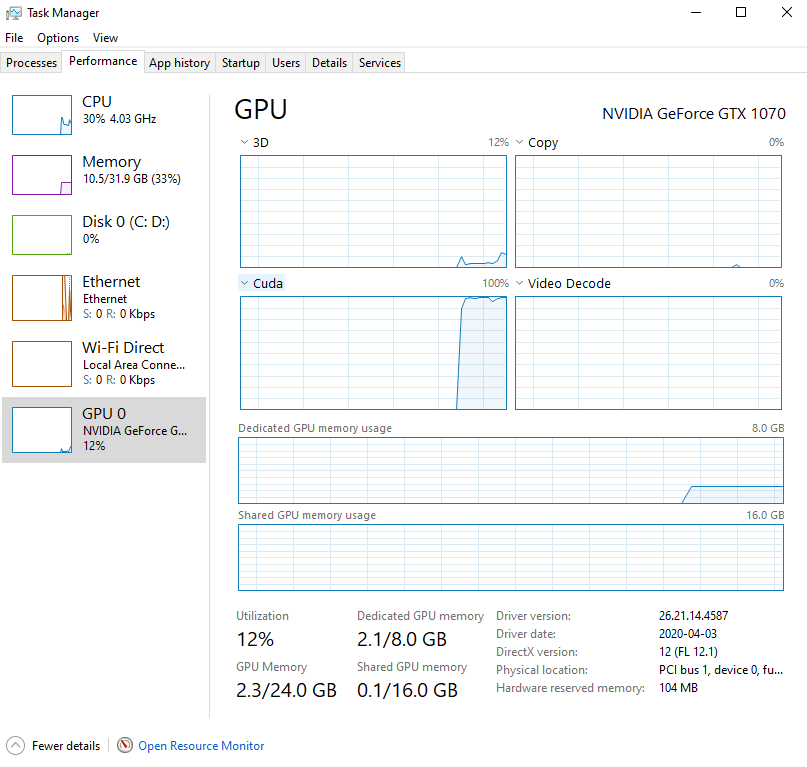
I just started a render on my computer, and you can clearly see when it fully using the GPU resources for CUDA even though it says usage is just 12% in total.

enter image description here

Edit

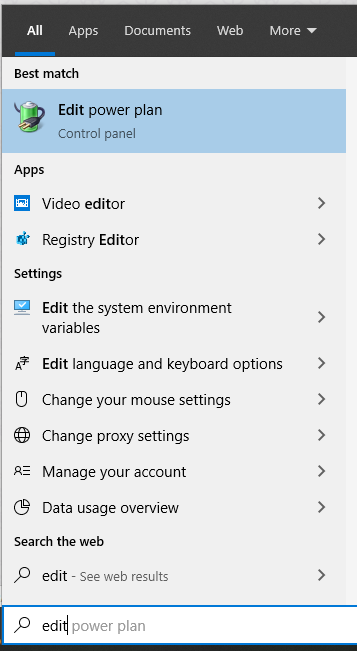
Windows may throttle your performance based on your power settings. Open up the start menu and search up Edit Power Plan.

enter image description here

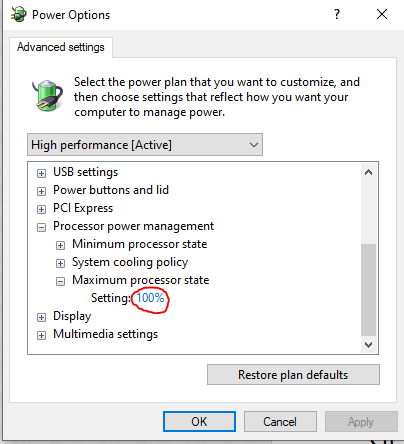
Then go to Change Advanced Power Settings, and under Processor Power Management, check that the Maximum Processor State is set to 100%.

enter image description here

$\endgroup$
1

You must log in to answer this question.

Not the answer you're looking for? Browse other questions tagged .