10
$\begingroup$

I'm trying to create a 3D heat map model out of data that I have from a csv file. I have a few thousand data points with XYZ coordinates.

I'm able to import the data into blender as a point cloud with this python script, however I would like to create a model with solid faces. Is there a way when importing the data to somehow join the points to create faces instead of generating thousands of separate points?

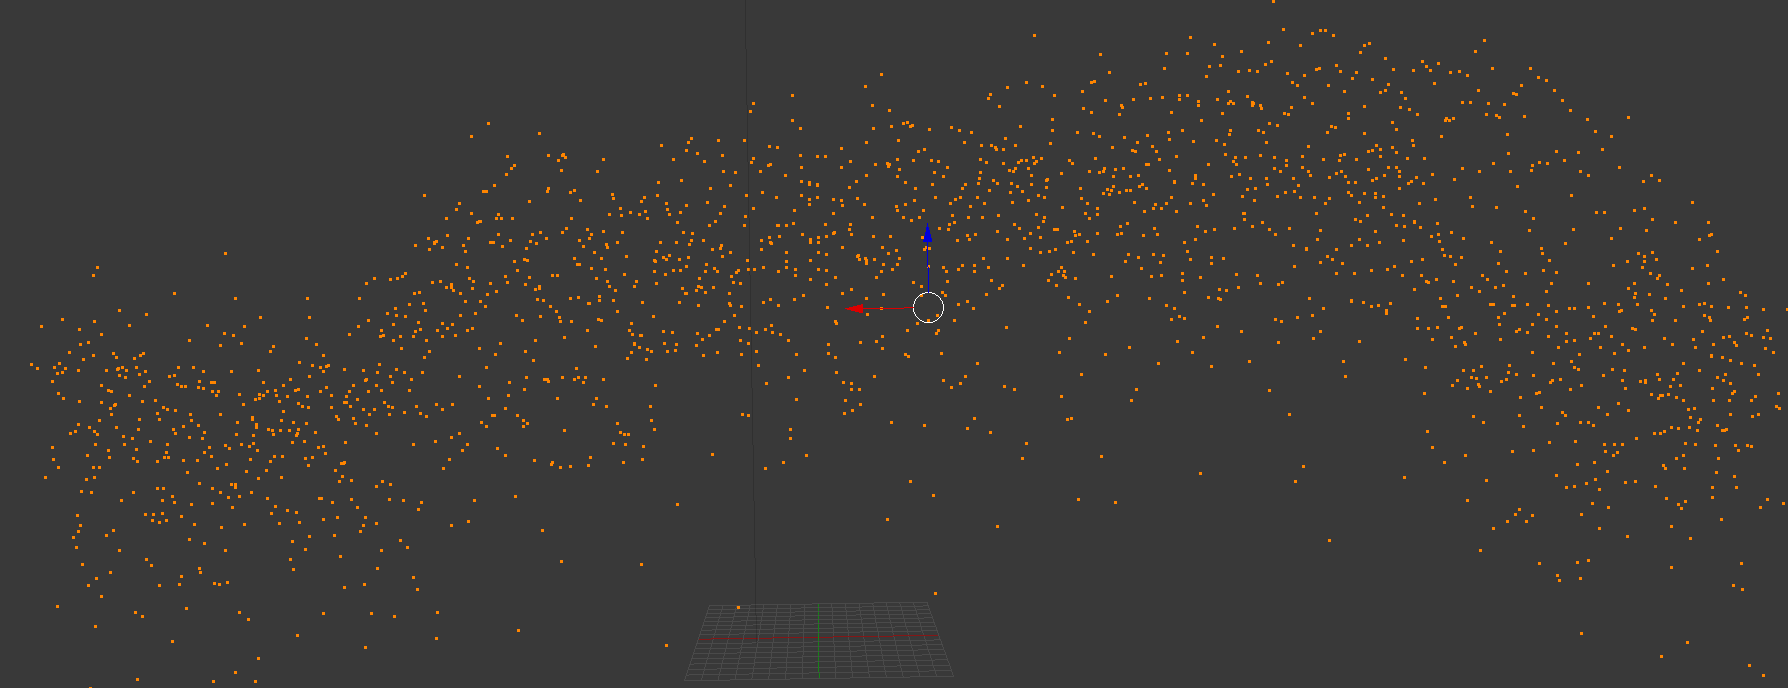
Currently, this what I have in terms of point cloudenter image description here

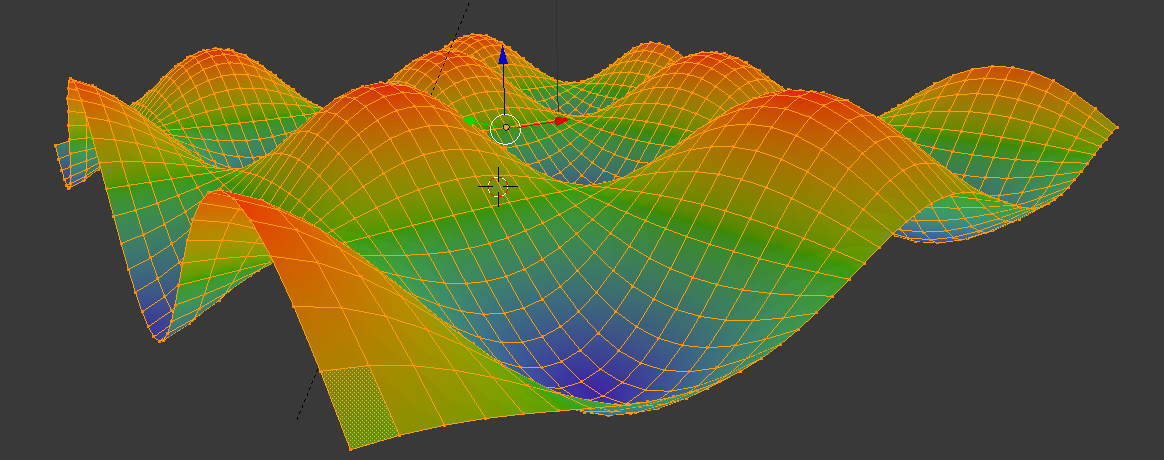
The end product would look something like this (minus the texture) and obviously the model wouldn't be as regular as this oneenter image description here

Any help is greatly appreciated!

$\endgroup$
3
  • 1
    $\begingroup$ Are the points in a regular order? Or may their index be semi-random? In the last case, you should probably obtain better results with Meshlab which has several tool for meshing pointclouds. $\endgroup$
    – Carlo
    Commented Mar 27, 2017 at 22:21
  • $\begingroup$ Has said @Carlo, is there some constant aspects in the cloud of points? For instance in the file itself or because X,Y are a grid? To go further, could you give an access to a sample file? $\endgroup$
    – lemon
    Commented Mar 28, 2017 at 11:42
  • $\begingroup$ The points are indexed randomly based on an arbitrary origin. I've uploaded a sample of the csv and a picture of what the data is representing. The X and Y coordinates are indeed a grid, while the Z value represent the power levels at that location. I've been able to mesh the point cloud in Meshlab with the Poisson reconstruction, however I'd ideally want to automate the model creation process in Blender only if possible. $\endgroup$
    – DanielP
    Commented Mar 28, 2017 at 12:46

2 Answers 2

11
$\begingroup$

From the file you provided, here is the result:
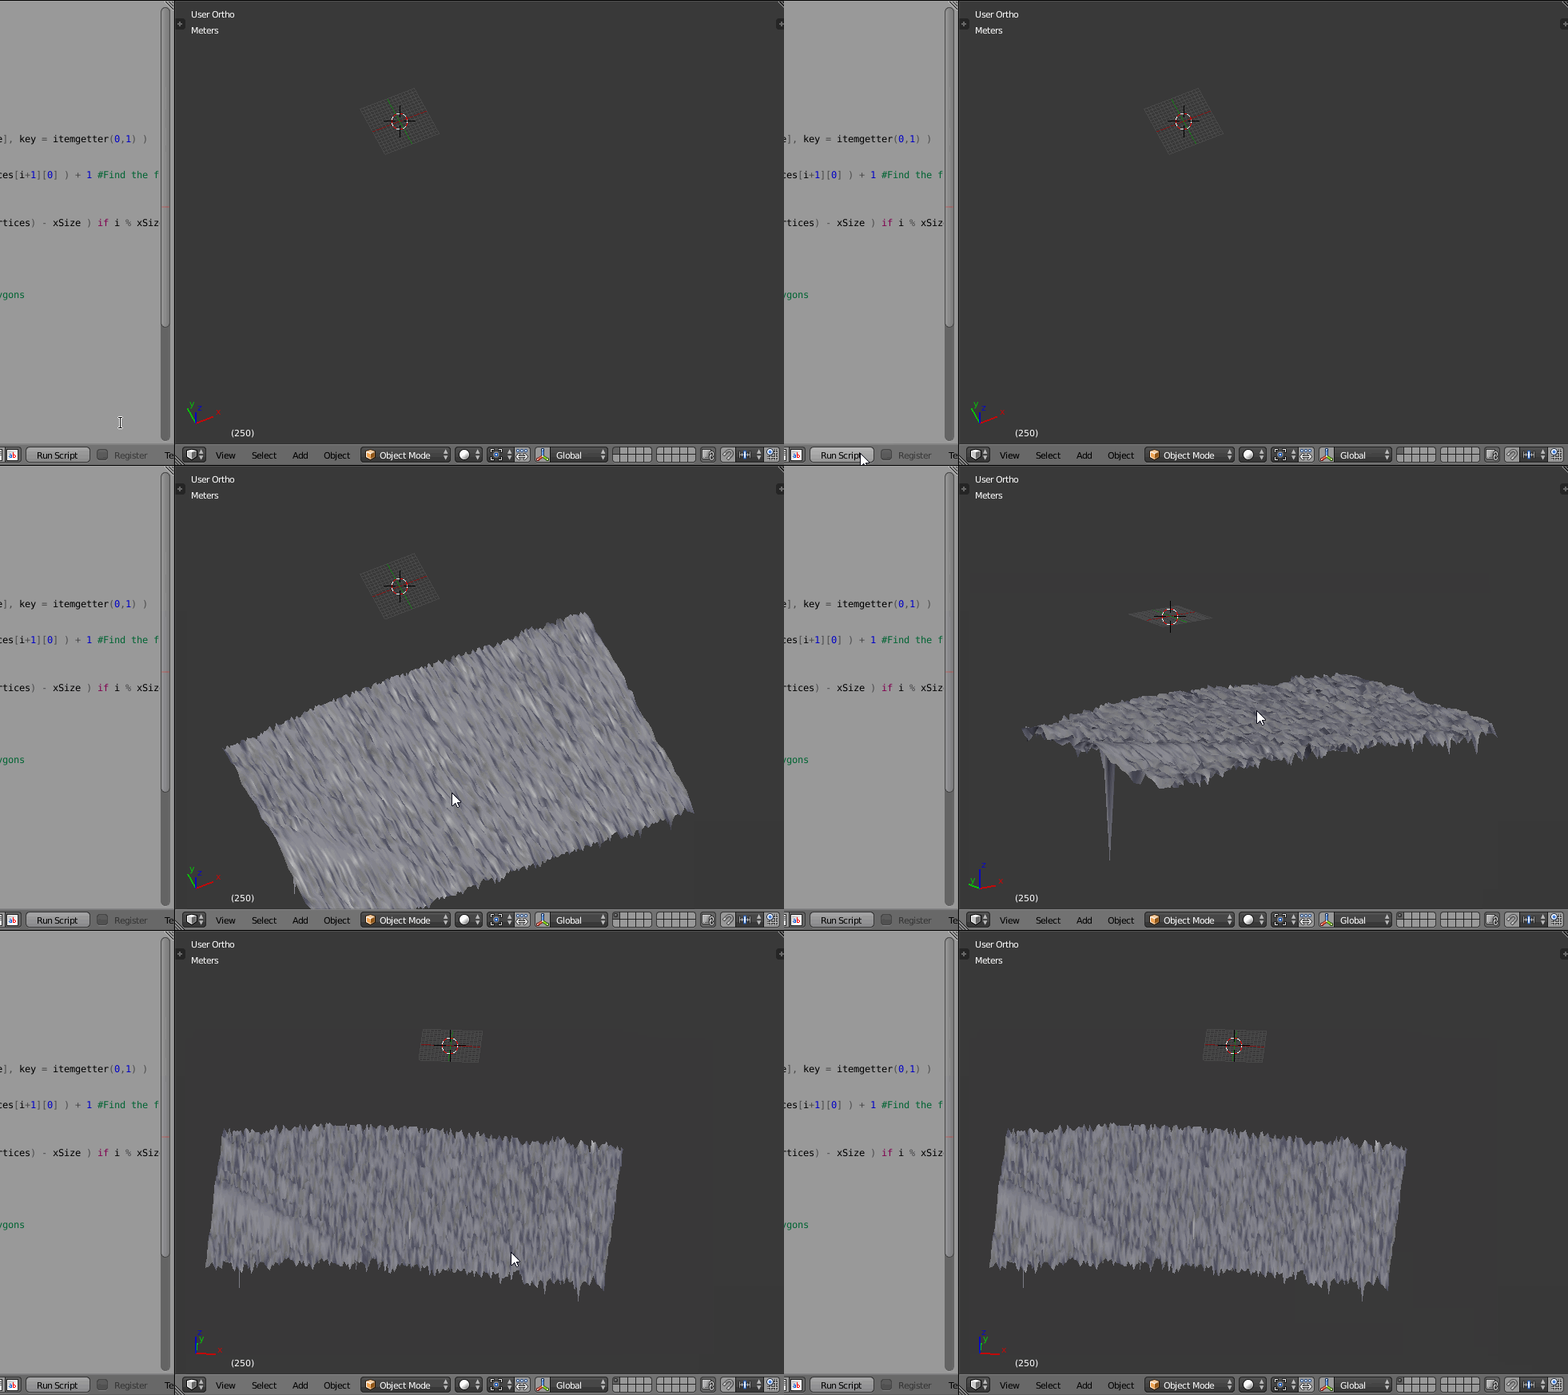
enter image description here

Effectively, this is not as regular as the sample image in the question!!

This script works only if we have a rectangular grid along X and Y.

Here is commented code (tell me if some additional explanations are needed):

import bpy
import csv
from operator import itemgetter

csvfile = open('G:\\Telechargements\\Heatmap_ES_output_01.csv')

inFile = csv.reader(csvfile, delimiter=',', quotechar='"')
# skip header
inFile.__next__()

#Read and sort the vertices coordinates (sort by x and y)
vertices = sorted( [(float(r[0]), float(r[1]), float(r[2])) for r in inFile], key = itemgetter(0,1) )

#********* Assuming we have a rectangular grid *************
xSize = next( i for i in range( len(vertices) ) if vertices[i][0] != vertices[i+1][0] ) + 1 #Find the first change in X
ySize = len(vertices) // xSize

#Generate the polygons (four vertices linked in a face)
polygons = [(i, i - 1, i - 1 + xSize, i + xSize) for i in range( 1, len(vertices) - xSize ) if i % xSize != 0]

name = "grid"
mesh = bpy.data.meshes.new( name ) #Create the mesh (inner data)
obj = bpy.data.objects.new( name, mesh ) #Create an object

obj.data.from_pydata( vertices, [], polygons ) #Associate vertices and polygons

obj.scale = (1, 5, 0.2) #Scale it (if needed)
for p in obj.data.polygons: #Set smooth shading (if needed)
    p.use_smooth = True

bpy.context.scene.objects.link( obj ) #Link the object to the scene

Blender 2.8

For 2.8:

The last line:

bpy.context.scene.objects.link( obj )

should be replaced by:

bpy.context.scene.collection.objects.link( obj )
$\endgroup$
2
  • $\begingroup$ This works perfectly for the data that I have. If you don't mind, could you explain the line 'polygons = [(i, i - 1, i - 1 + xSize, i + xSize) for i in range( 1, len(vertices) - xSize ) if i % xSize != 0]' ? I get that it creates the face between 4 vertices, but I don't understand the 'if' statement at the end. Merci! $\endgroup$
    – DanielP
    Commented Mar 28, 2017 at 17:17
  • $\begingroup$ i modulo the width. That allows to skip 0, 1*width, 2*width, ... as vertex index. Between 3 points you have 2 faces (edges). Je ne sais pas si je suis clair... !! $\endgroup$
    – lemon
    Commented Mar 28, 2017 at 17:27
6
$\begingroup$

Here's a possible solution using Sverchok add-on:

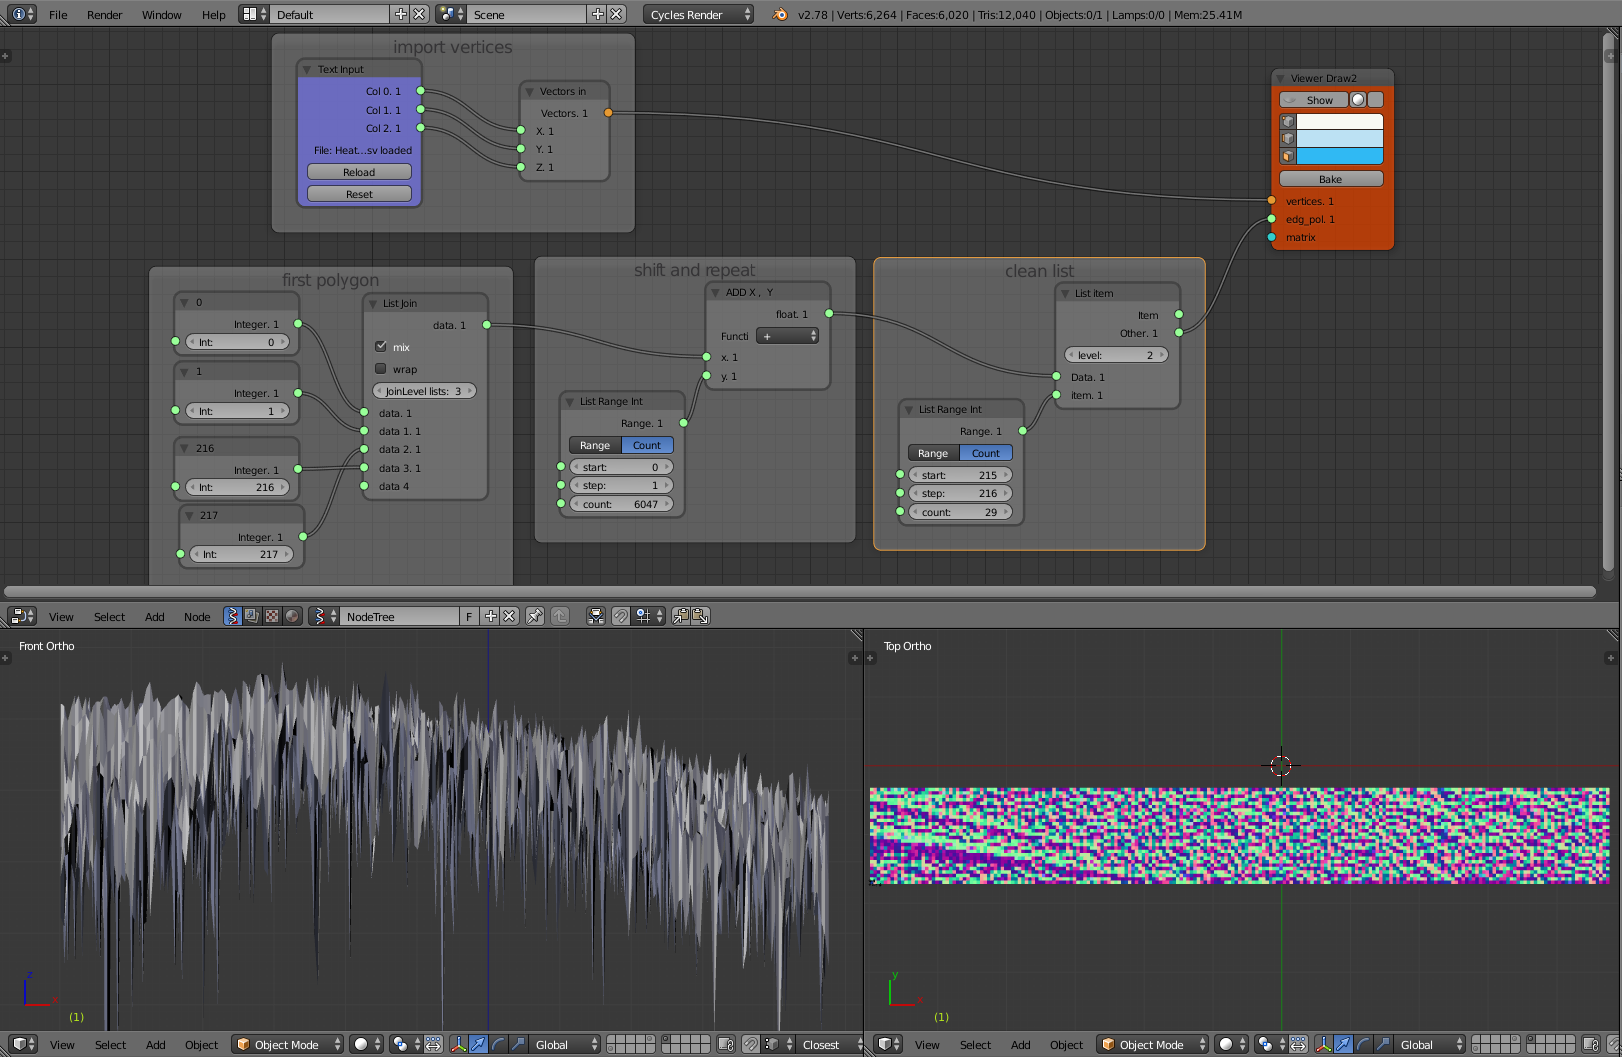
Basically we can import the points directly from the cvs file with the Text input node and transform the coordinates in vertices with the Vector in node.

Then what's left is to provide a sequence of indexes based on the specific grid of acquisition. In this particular case, we are defining the first polygon (a quad) and then repeating the process for every quadrlet with a combination of list managing and a int range.

enter image description here

The last segment of the algorithm is used to get rid of the faces built by the vertices of a row and the first of another. In this particular case is deleting one item of the list every 216.

$\endgroup$
4
  • $\begingroup$ Interesting (+1). About your note, this is precisely the question of the OP in the comment (the need of i%xSize). Is there a way to do it with Sverchock? $\endgroup$
    – lemon
    Commented Mar 28, 2017 at 17:51
  • 2
    $\begingroup$ Yes, you can implement the same math you used, or use methods like the one I added to the answer. $\endgroup$
    – Carlo
    Commented Mar 28, 2017 at 18:25
  • $\begingroup$ I tried to plot using your script. It is showing error can you have quick look CSV file is here drive.google.com/open?id=1VRqSRnDcolSaYv-_6UsfdKV8uaov3Z41 $\endgroup$ Commented Feb 23, 2020 at 23:13
  • $\begingroup$ Unfortunately the script works only for a rectangular grid distribution of points like the one provided by the OP. Yours needs a different implementation, like a marching cube alghorithm or something similar. There is no trivial solution. $\endgroup$
    – Carlo
    Commented Feb 27, 2020 at 18:56

You must log in to answer this question.

Not the answer you're looking for? Browse other questions tagged .