Based on the work of [1] I obtained the depth data of my scene as shown in the code bellow:
scene.use_nodes = True
tree = scene.node_tree
links = tree.links

# create input render layer node
rl = tree.nodes.new('CompositorNodeRLayers')

# create output node
v = tree.nodes.new('CompositorNodeViewer')
v.use_alpha = False

# Links
links.new(rl.outputs['Z'], v.inputs[0]) # link Z to output

bpy.ops.render.render()

# get viewer pixels
pixels = bpy.data.images['Viewer Node'].pixels
# size is always width * height * 4 (rgba)
pixels = np.array(pixels)[::4]

ix = scene.render.resolution_x
iy = scene.render.resolution_y
depth = np.zeros((ix/2,iy/2))

for i in range(0, int(round(ix/2))):
 for k in range(0, int(round(iy/2))):
     depth[i,k] = pixels[i+k]

np.save('...\\outfile.npy', depth)
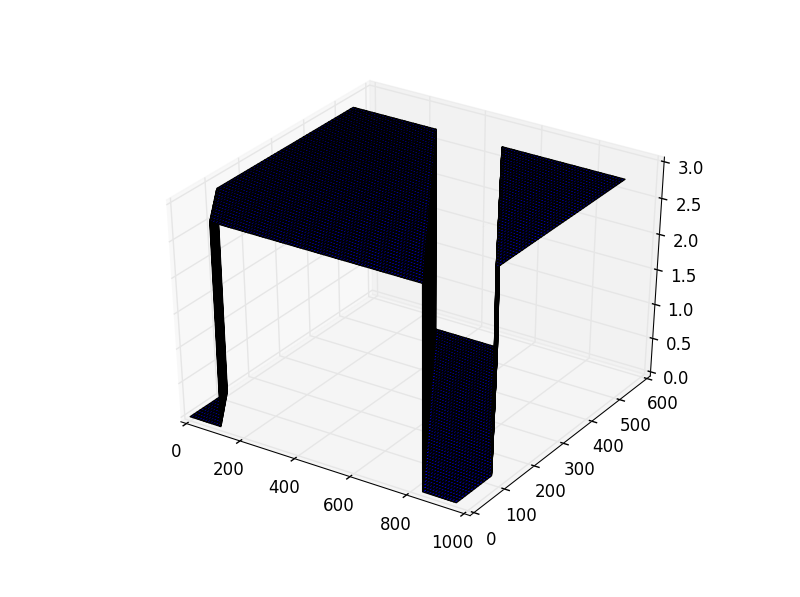
I set up the nodes, forward the z-data to the output node, render and save the pixels as an array. Since I use depth data instead of RGBA, I only use every 4-th element in the array since the other 3 ones are equal. Further, I use the dimensions of the image to setup a ndarray with numpy (depth) wich I save to an .npy file finally. Somewhere in this part I make a mistake since following code (from commandline) generates a somehow weird looking plot (shown below as well)
from mpl_toolkits.mplot3d import Axes3D
import matplotlib.pyplot as plt
import numpy as np

data = np.load('...\\outfile.npy')
x, y = np.mgrid[:data.shape[0], :data.shape[1]]
fig = plt.figure()
ax = fig.add_subplot(1,1,1,projection="3d")
surf=ax.plot_surface(x,y,data)
plt.show()
For a centered cube I get the following outcome:
So I hope somebody can give me a hint on where to look exactly for the error, and also I would be very thankfull for coding and style tips. I also found similar posts, but no one where the obtained data is visualized.

