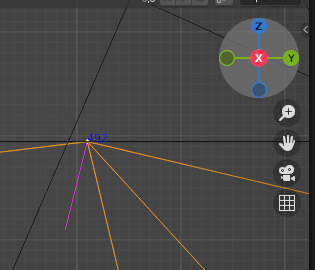
I have a mesh with custom split normals. When I look at the normals on the loops through python I see the values I expect, but when I look at the split normals visually in edit mode, they are quite different--and the shading matches what the view is showing.
How do I get the view to show the custom normal data I see in the mesh data with python?
I've tried C.object.data.calc_normals_split() but that copies the values I see in the view into the values I see in python. I want to go the other way.
Details:
C.object.data.loops[1967].vertex_index
492

C.object.data.loops[1967].normal
Vector((-0.5192142128944397, 0.7101643681526184, 0.4754820466041565))
Viewing the object in edit mode with vertex 492 selected, showing split normals:

You can see the y and z values of this split normal are negative whereas they are positive when I printed the loop normal.

obj.data.polygons.vertsor in bmeshbm.faces.verts. Just looping over the verts by themselves will only produce the averaged normal, the split normals are most likely stored in the polygons or maybe the loops. $\endgroup$