Well... this is not a "nurbs" curve, but it might be useful.
If it's a "height field" (instead of a 3d object) you can either create a grid and make a TIF like DEM (digital elevation model).
You can take min heights, you get a (DTM - digital terrain model - as long as you have filtered the ground points) / max (DSM - digital surface model) / mean or any other statistics.
It's achievable with geometry nodes.
Source cloud
Given an object with "points" to serve as a point cloud like this:

Main geometry nodes
We can take any "mesh" object and add these geometry nodes, which:
- Creates a grid (pixels) based on the point cloud size and given pixel size
- PS: in this case, the points on the grid are the "centers" of the pixels (this leads to a shrinking of the borders when pixel sizes are big)
- Loops each pixel (grid point) doing:
- Get cloud points with XY within the pixel
- Sets the height of the point (pixel) as the mean of the filtered cloud points (can change it to max, min or custom calculation)
- Deletes grid points with no data (no cloud points were within that pixel)
- This can be improved further to interpolation from neighbors, but that would be an extra work
- Pixel sizes can be increased to have full coverage

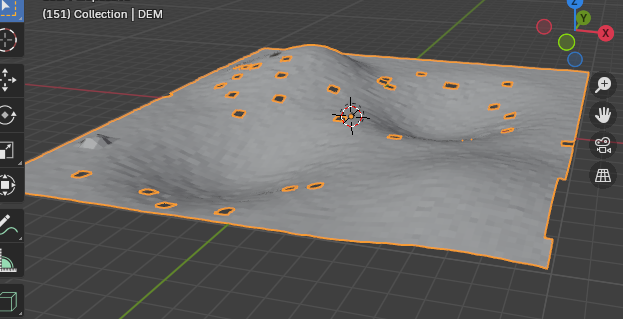
Example with small pixel size (and some "no data" pixels):
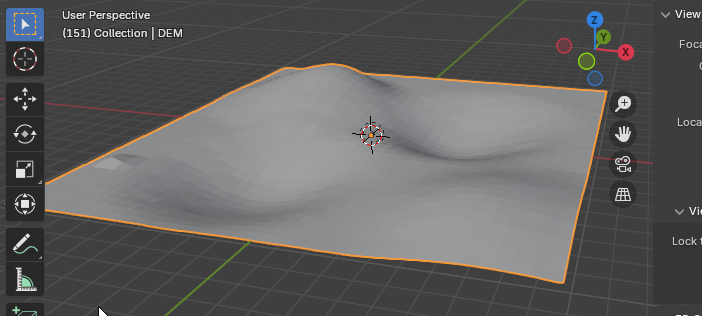
Example with big pixel size (full coverage):
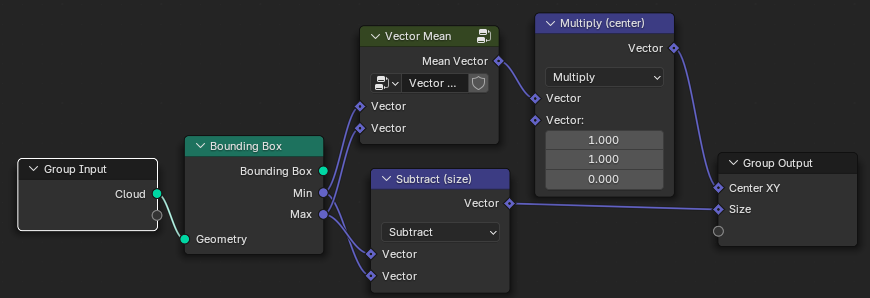
Cloud Properties node group
Gets a bounding box of the cloud and calculates its size and center to help grid creation. ("Vector mean is (v1 + v2) / 2)
Make Grid node group
Takes the size, pixel size and center and create a grid.
Each point in the grid is the "center" of the pixel (half pixel size is lost at the borders)

Loop Pixel node group
For each pixel (Grid point), separates the cloud poings inside this pixel, gets the mean and sets the grid height:

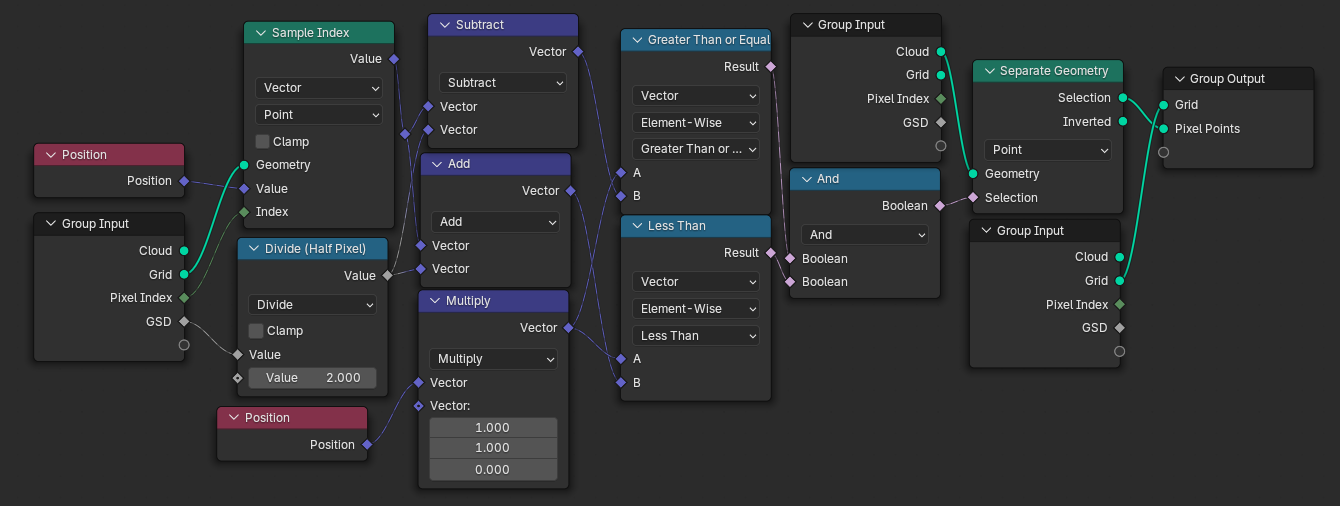
Get Pixel Points node group
Filters the cloud points that are within the pixel limits:
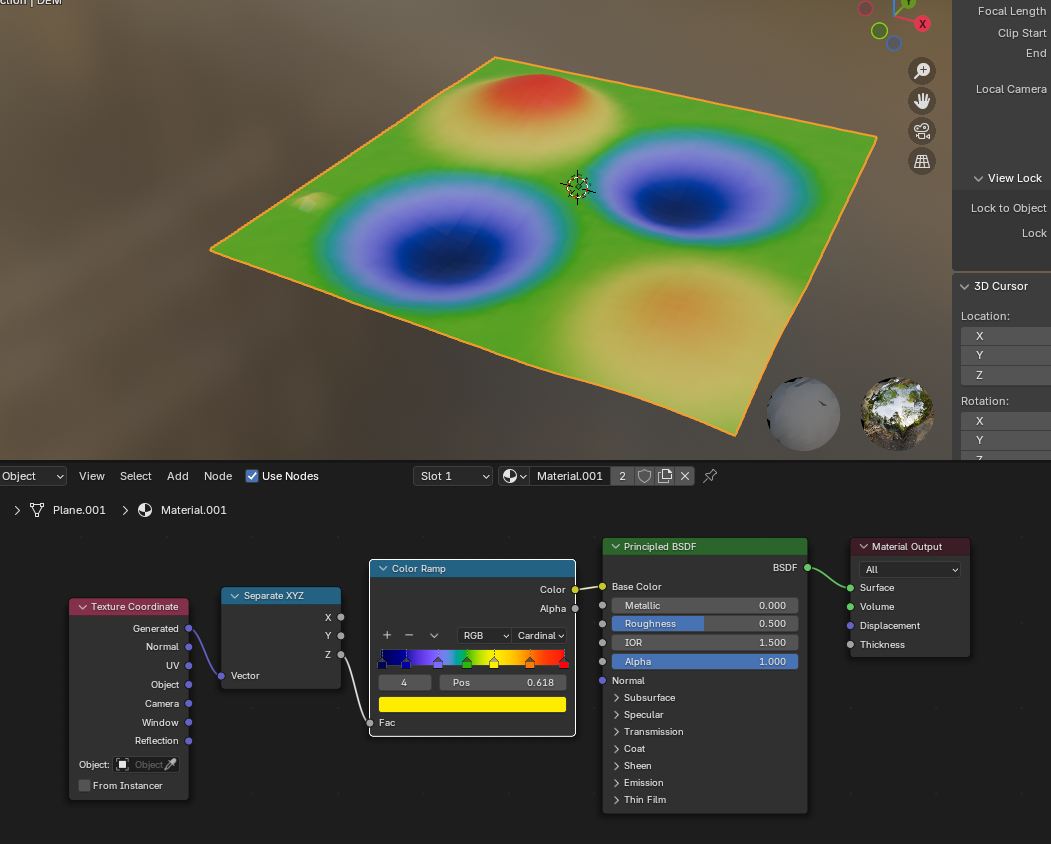
Gift shader
And a gift shader that shows DEM elevation by color:
File


