13
$\begingroup$

This question asked how to plot the graph of 2D parametric equations using Geometry Nodes. But how about parametric surfaces generated by parametric equations of the form

$$ x = f(u, v)$$ $$ y = g(u, v)$$ $$ z = h(u, v)$$ $$ a \le u \le b$$ $$ c \le v \le d$$

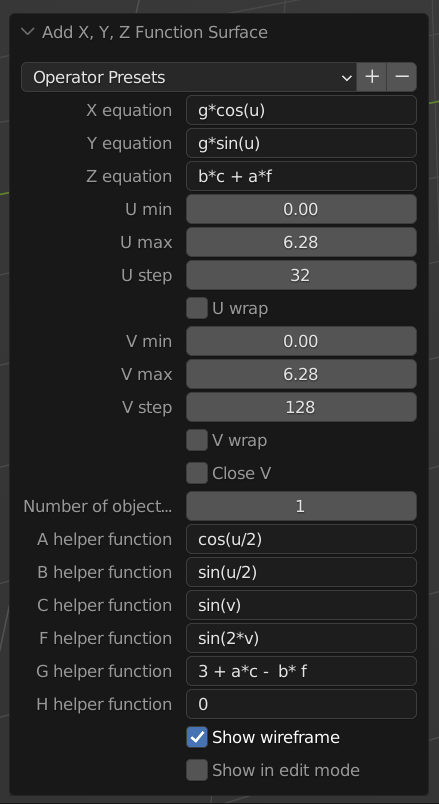
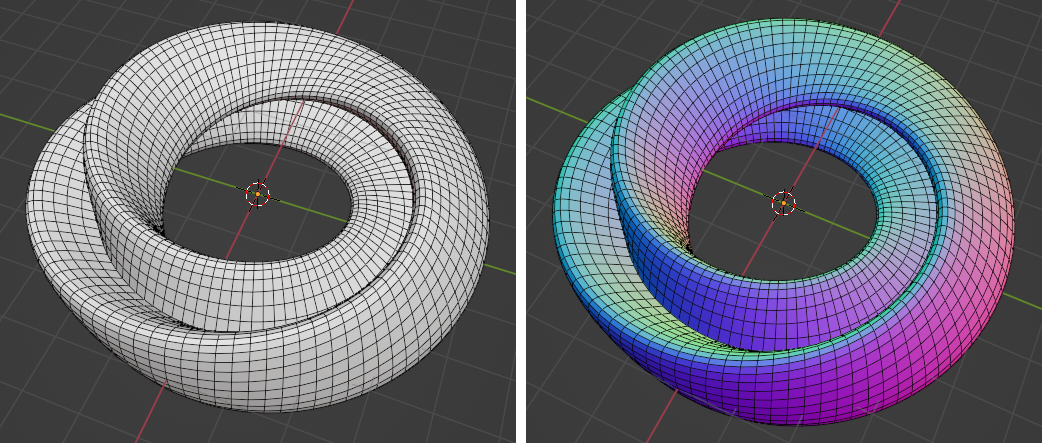
like this parametric "figure 8" immersion Klein Bottle:

parametric Klein Bottle

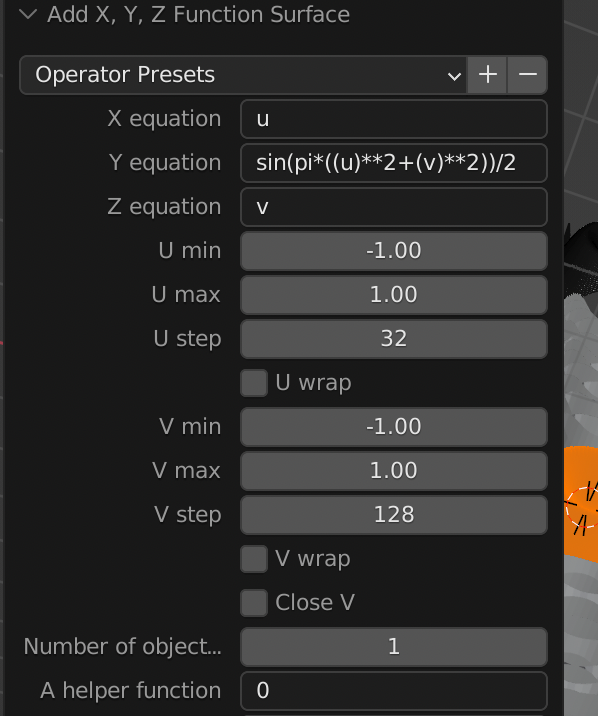
I know there are other methods for doing this. For example, I can use the XYZ Math Surface option, this time using both $u$ and $v$ rather than just $u$ for a curve:

parametric equations for the figure 8 immersion Klein bottle.

But how do I do this with geometry nodes?

NOTE: this is not a question about surfaces where z is a direct function of x and y (those represented by $z = f(x,y)$) but about equations were $x$, $y$, and $z$ are all calculated as functions of two other variables, $u$ and $v$. The difficulty arises from the fact that you can't solve these using an (x, y) grid.

$\endgroup$
3
  • 1
    $\begingroup$ For diplomacy's sake, if you agree with me about the equivalence of @LuckyOne 's answer, and my later one, and they do answer your question satisfactorily, I would be very happy if you ticked his, not mine :) $\endgroup$
    – Robin Betts
    Commented Apr 13, 2022 at 18:18
  • 1
    $\begingroup$ @RobinBetts Your wish is my command. I've upvoted both answers, but I'll wait for a day or two to see if anyone comes up with a solution that doesn't have the normals problem; but if a better answer doesn't show I'll except LuckyOne's. $\endgroup$ Commented Apr 13, 2022 at 19:06
  • 1
    $\begingroup$ I'll try to figure out the normals thing.... but atm I can't think of a fix. Maybe if I do a bit of washing-up or ironing :) .... $\endgroup$
    – Robin Betts
    Commented Apr 13, 2022 at 19:19

2 Answers 2

11
$\begingroup$

Because your formula was too complicated for me...i just took another formula (but the principle is the same)

so here is an example:

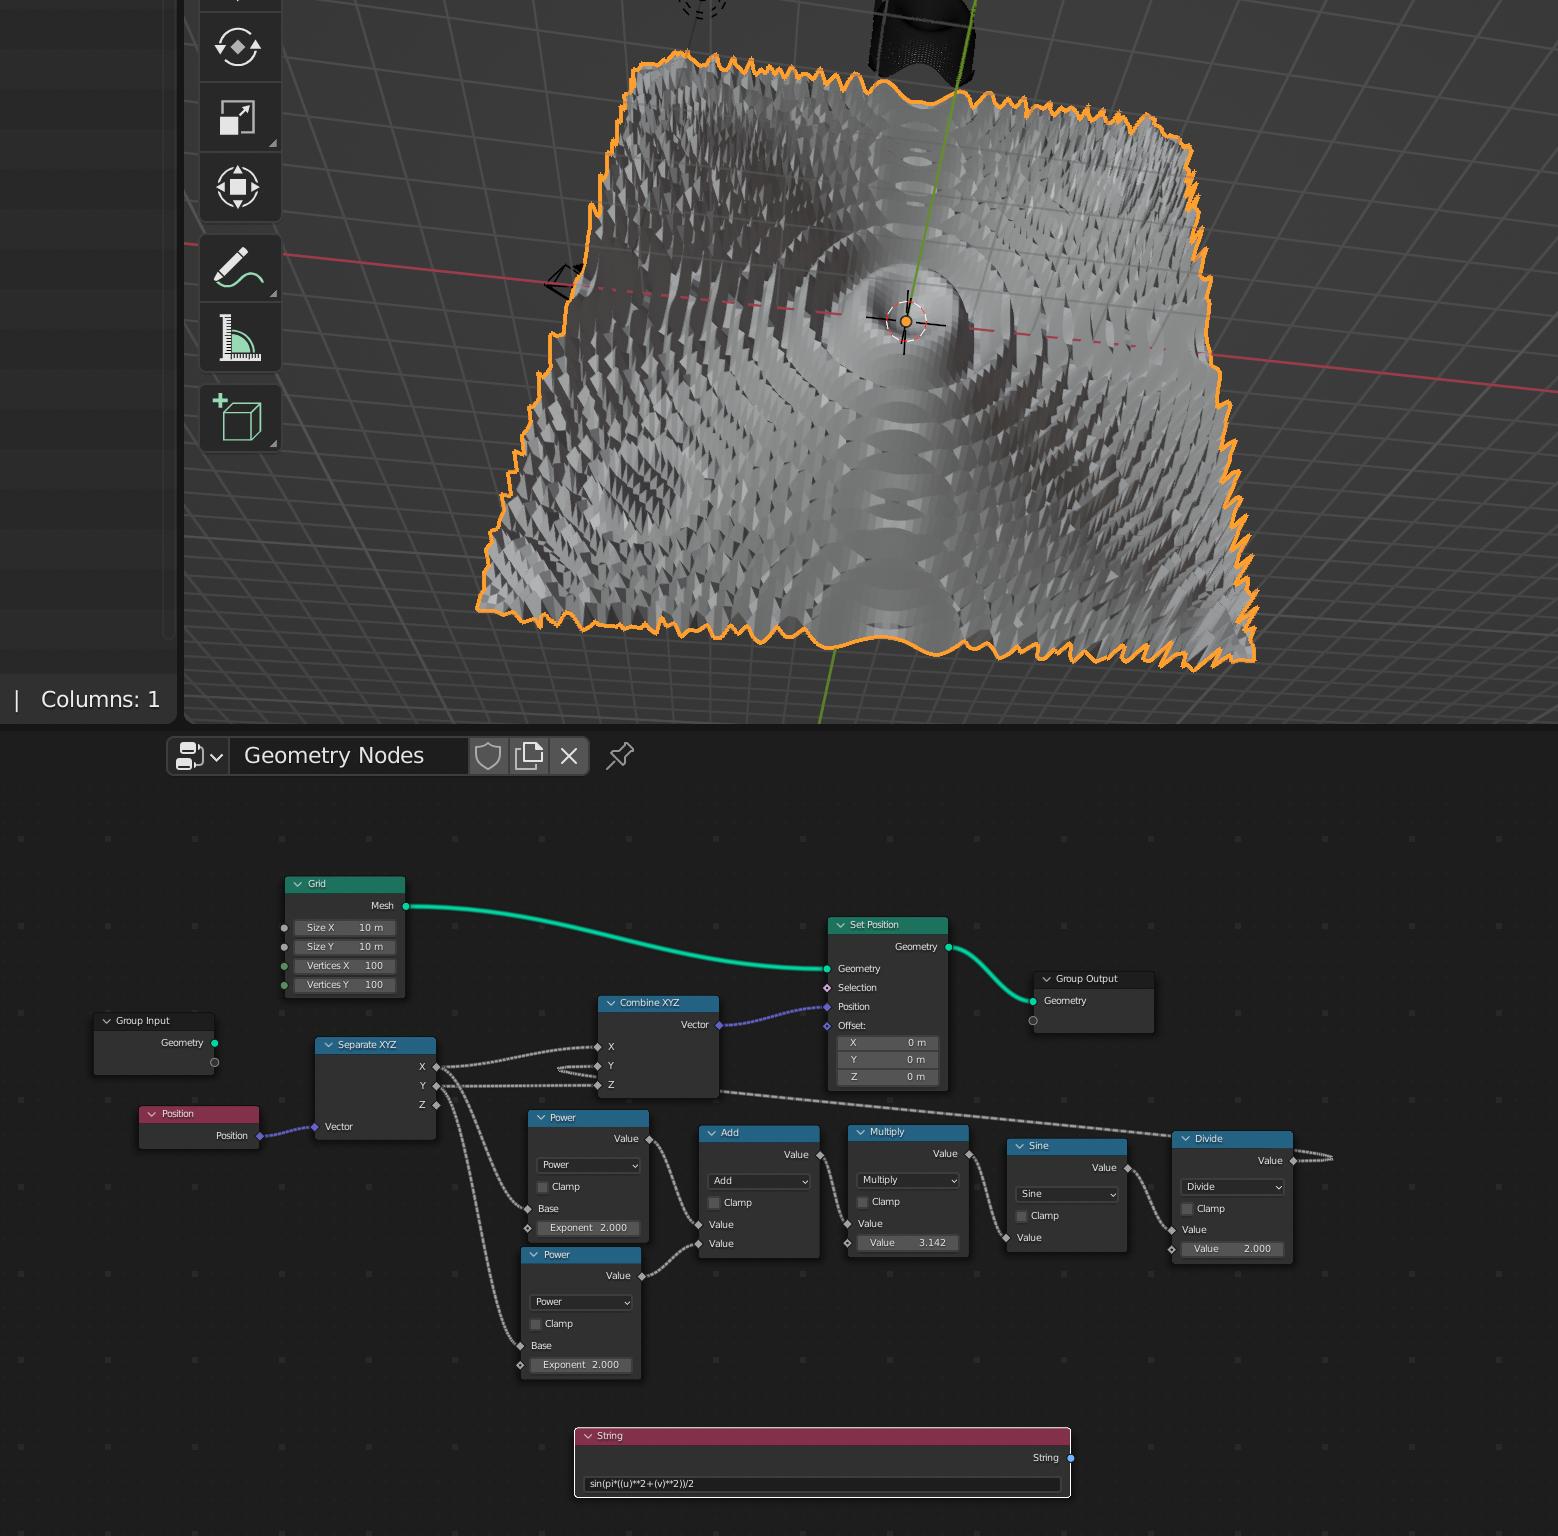
enter image description here

I took the example from math surface -> cosinus

formula:

enter image description here

$\endgroup$
0
14
$\begingroup$

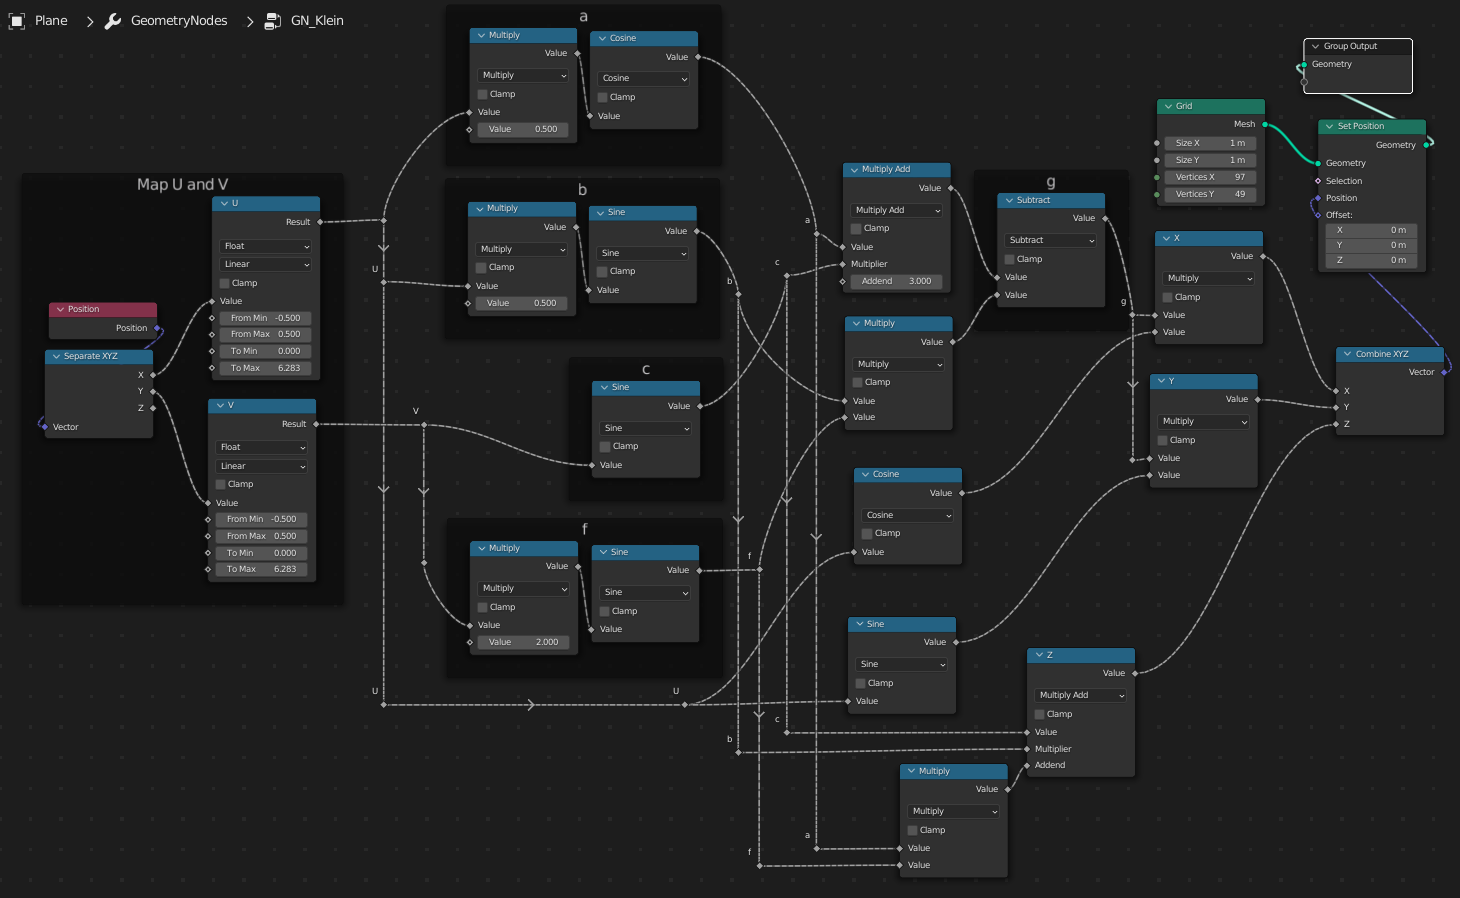
Will this way do? It's actually the same as @LuckyOne's, and the 2D answer you refer to. Instead of starting with a curve, start with a 'UV' grid, at the desired resolutions. Map the dimensions of the grid to the desired ranges of U and V.

Use the U(X) and V(Y) Positions of the grid's points as the inputs to your expressions for X', Y' and Z'. This is a lazy reproduction of your XYZ surface, imitating your helper functions:

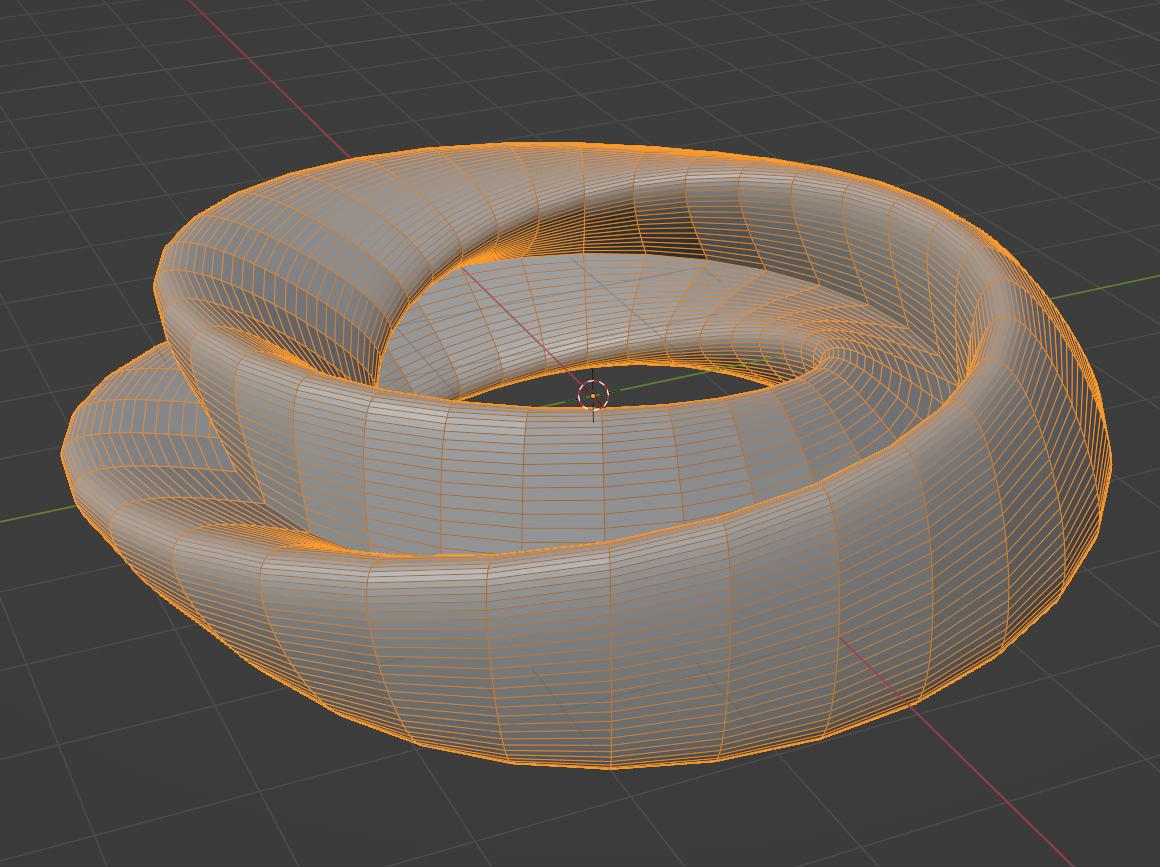
enter image description here

(Excuse the spaghetti.) )In this case, I couldn't figure out how to take the twist out of the normals,though, without applying the modifier and Alt N recalculating:

enter image description here

$\endgroup$
4
  • 2
    $\begingroup$ Don't put too much effort into figuring out the twist. I think it's an artifact of the object being a Klein bottle. XYZ Surface leaves the same twist in the same place. $\endgroup$ Commented Apr 13, 2022 at 20:11
  • $\begingroup$ @ugorek The link is fixed, now. Thanks. $\endgroup$
    – Robin Betts
    Commented May 30 at 18:27
  • $\begingroup$ What type of node are the "U" and "V" nodes in your screenshot? I haven't been able to figure that out from what's shown in the image. I did download your linked .blend file, but when I try to open it, Blender immediately crashes, so I can't see what those nodes are that way. $\endgroup$
    – Lawton
    Commented Jun 9 at 17:50
  • $\begingroup$ Hi, @Lawton! It's a bit concerning that the file crashes for you.. I'm having no trouble with it.. that's got me looking for local dependencies, I've opened it on more than one machine.. The 'U' and 'V' labelled nodes are Map Range > Float. They take the -.0.5 to 0.5 range of X and Y Positions in the default 1m grid, and map it ot 0 to 2*pi. Nowadays, there's a Map Range > Vector, so you can do it in one. $\endgroup$
    – Robin Betts
    Commented Jun 10 at 6:08

You must log in to answer this question.

Not the answer you're looking for? Browse other questions tagged .