Background
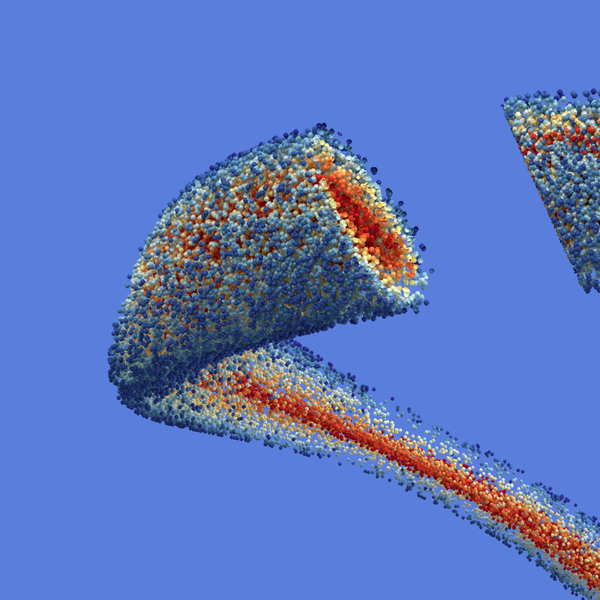
I want to render 3D points with color information for scientific visualization. I have several hundred thousands of points up to 2 million. For each point I have [xyz] coordinates and two scalars [t, tau]. The scalars should be shown as color and are currently mapped to uv-coordinates.
Wanted result
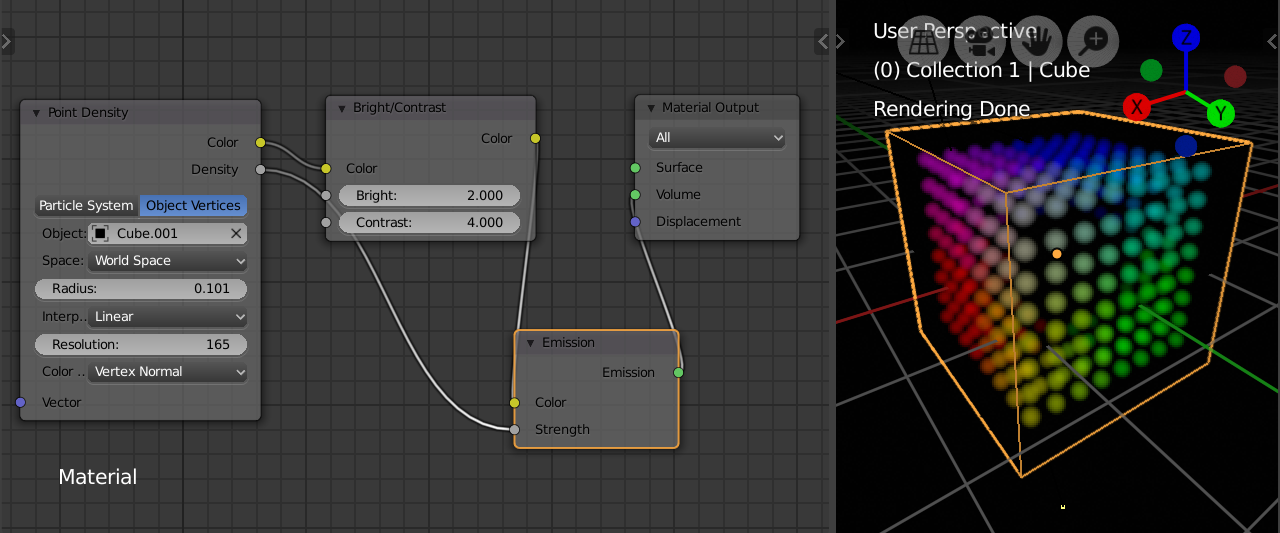
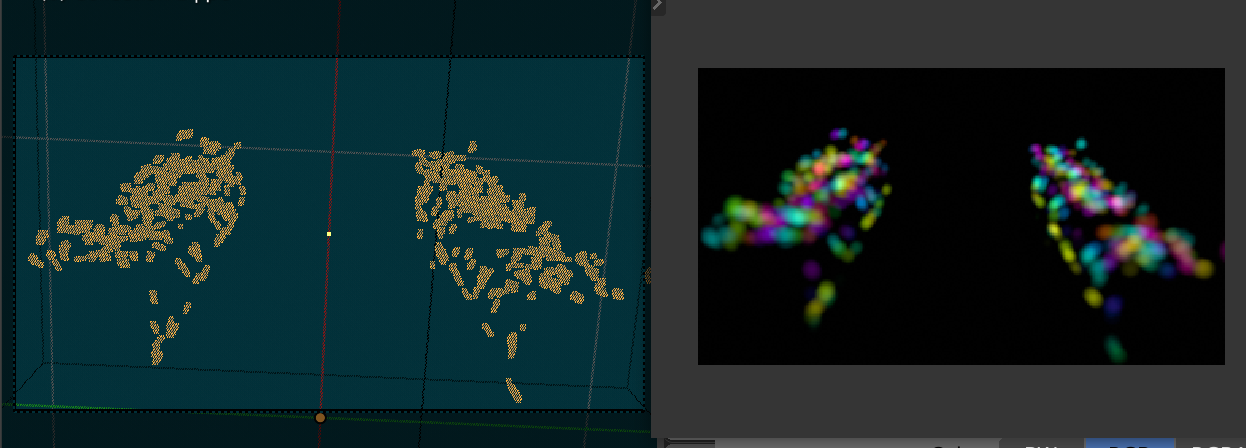
I want to achieve something like this but with (lots) more points/spheres:
Current solution
- Here is my script: visualisePointCloud.py
- Here is some example data: point_data.txt
My workflow
- load the data
- create/copy a sphere mesh
- move the copied mesh to [xyz] coordinates
- define the uv coordinates for the whole mesh with respect to [t, tau]
- repeat 2. to 4. for each data entry
- join all created meshes
Problem
While loading the points and creating the scene I get a slowdown. The first 1000 points work fine, but the overall process gets quickly slower. I am sure it has something to do with the commands I use from the API and the amount of objects I create.
I had two ideas to solve the problem - neither worked:
- Create a sphere mesh for each data entry and join them in the end. This leads to a huge amount of created objects, which slows down blender (compare this question).
- Create the meshes for a subset of the data entries and join these to a single object/mesh. Do this until all points are loaded. This leads to the problem, that the joining process gets more complicated and increasingly takes more time.
Questions
- Are there better commands I can use to speed up the process?
- Is there a better solution than copy a sphere mesh for each data entry and adjust its UV-coordinates for coloring. E.g. create one mesh and add vertices to it - how can I alter the UV-coordinates this way.
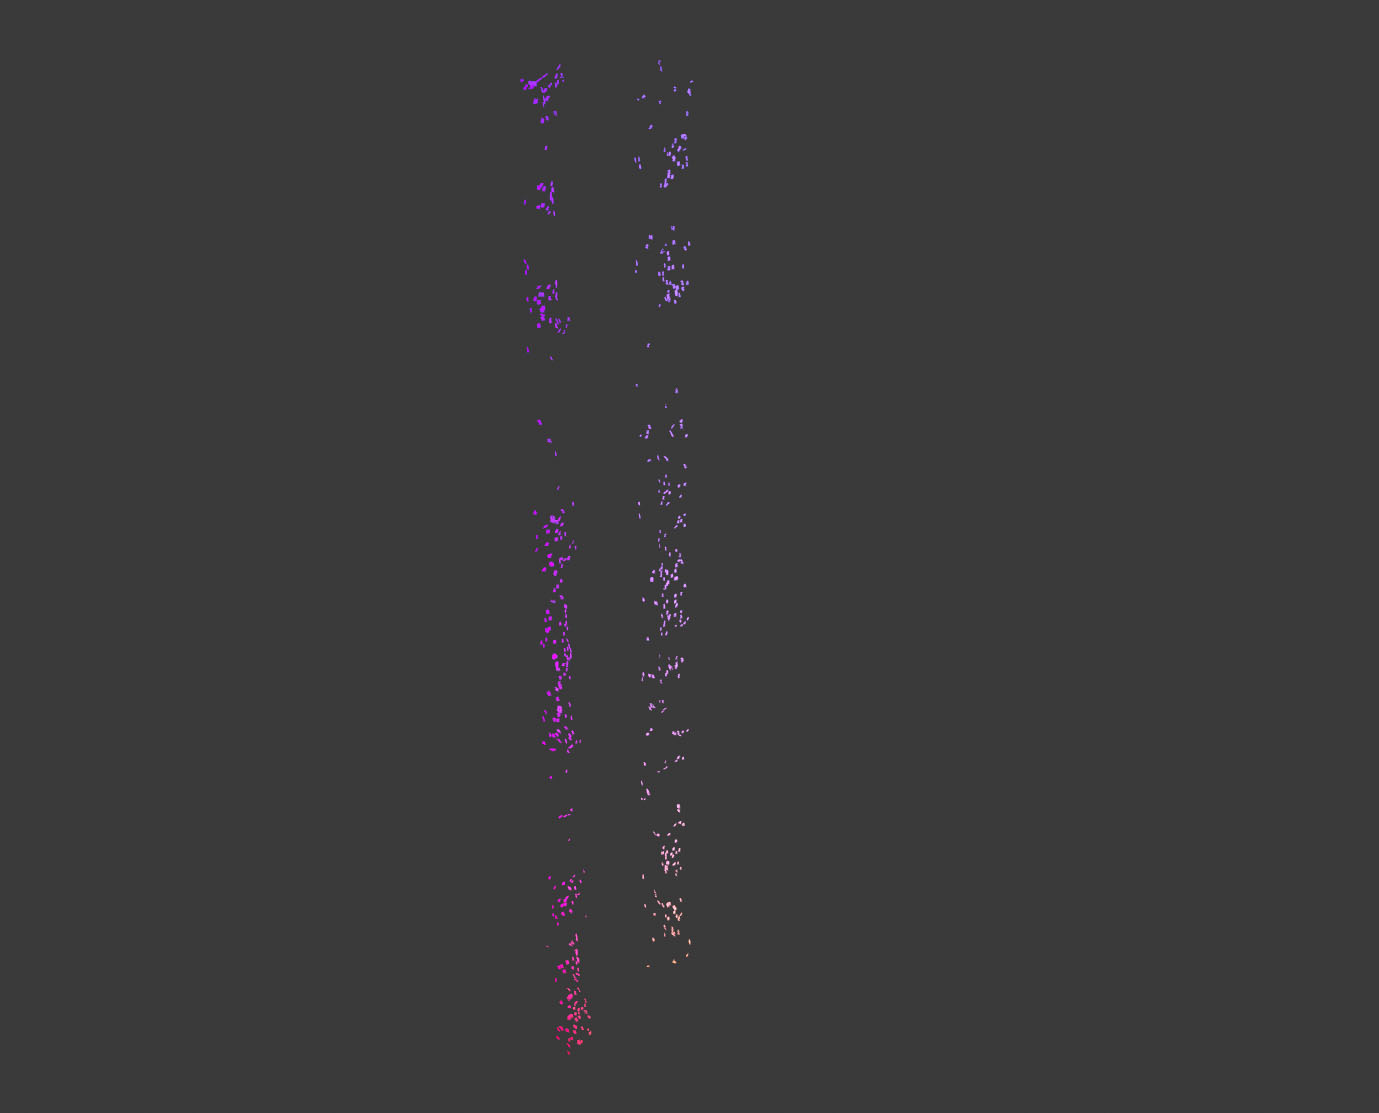
- Is there generally a better way to render a colored point cloud, e.g. this one is missing the colors.

