added 211 characters in body
Source Link
user159068
user159068

enter image description here

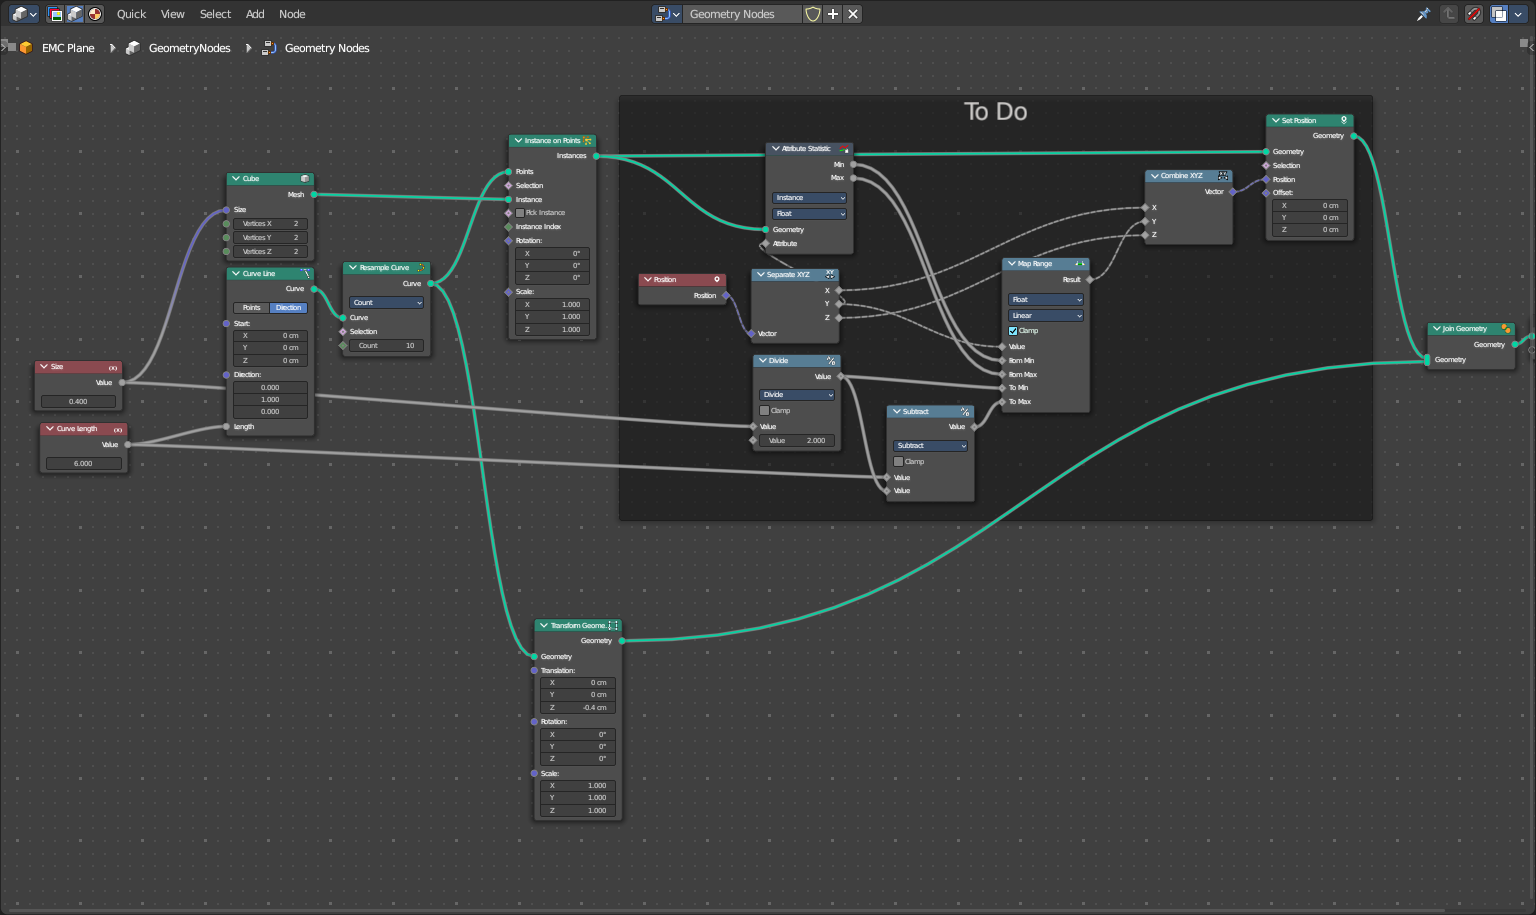
The Map Range Node and Attribute Statistics Node are the key nodes. The Map range is used to fit values within the desired range, while the Attribute statistics will let you know a set of values from the given field. The Min and Max values in the From sections on the Map Range Node should come from the min and max values from the attribute statistics (Remember to set it to Instances). I arrayed them in the Y-axis, so I separated the position and only edited the y values. The To Min value should be half the cube's size divided by two. This is because we want itthe cube is instanced from the center, while the goal is to start from the endexact beginning. So we add the other half to accomplish the full size of the cube. Since we also want the end of the last cube to be at the exact end of the line, we simply subtract half its size from the length of the curve to do the opposite of what we did to the first cube. This becomes the To max value. I recombined the vector with edits only on the Y-Axis and used it for the Set Position Node. I hope this makes sense.

Here is the node setup:

enter image description here

enter image description here

The Map Range Node and Attribute Statistics Node are the key nodes. The Map range is used to fit values within the desired range, while the Attribute statistics will let you know a set of values from the given field. The Min and Max values in the From sections on the Map Range Node should come from the min and max values from the attribute statistics (Remember to set it to Instances). I arrayed them in the Y-axis, so I separated the position and only edited the y values. The To Min value should be the cube's size divided by two because we want it to start from the end. Since we also want the last cube to be at the exact end of the line, we simply subtract half its size from the length of the curve. This becomes the To max value. I recombined the vector with edits only on the Y-Axis and used it for the Set Position Node.

Here is the node setup:

enter image description here

enter image description here

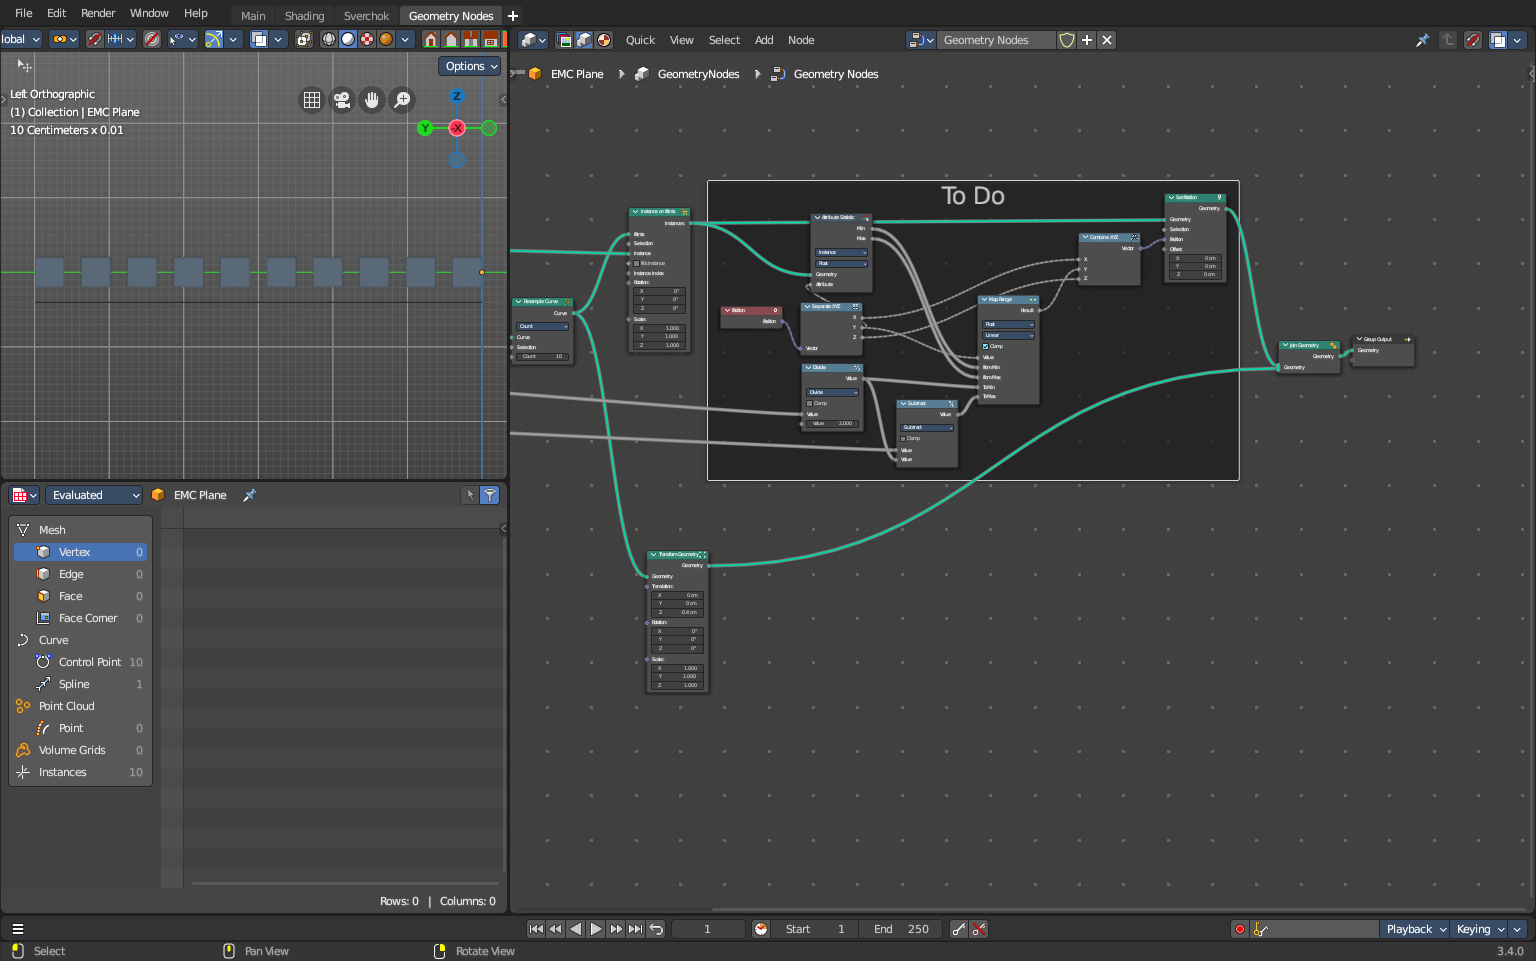
The Map Range Node and Attribute Statistics Node are the key nodes. The Map range is used to fit values within the desired range, while the Attribute statistics will let you know a set of values from the given field. The Min and Max values in the From sections on the Map Range Node should come from the min and max values from the attribute statistics (Remember to set it to Instances). I arrayed them in the Y-axis, so I separated the position and only edited the y values. The To Min value should be half the cube's size. This is because the cube is instanced from the center, while the goal is to start from the exact beginning. So we add the other half to accomplish the full size of the cube. Since we also want the end of the last cube to be at the exact end of the line, we simply subtract half its size from the length of the curve to do the opposite of what we did to the first cube. This becomes the To max value. I recombined the vector with edits only on the Y-Axis and used it for the Set Position Node. I hope this makes sense.

Here is the node setup:
enter image description here

Source Link
user159068
user159068

enter image description here

The Map Range Node and Attribute Statistics Node are the key nodes. The Map range is used to fit values within the desired range, while the Attribute statistics will let you know a set of values from the given field. The Min and Max values in the From sections on the Map Range Node should come from the min and max values from the attribute statistics (Remember to set it to Instances). I arrayed them in the Y-axis, so I separated the position and only edited the y values. The To Min value should be the cube's size divided by two because we want it to start from the end. Since we also want the last cube to be at the exact end of the line, we simply subtract half its size from the length of the curve. This becomes the To max value. I recombined the vector with edits only on the Y-Axis and used it for the Set Position Node.

Here is the node setup:

enter image description here