0
$\begingroup$

I hope this question is allowed on this forum. I am currently using a non-ideal setup for my renders, specifically an Apple MacBook Pro M2 Pro. I've been learning on this system and plan to upgrade soon. Despite its limitations, I've managed to render complex environments in the past, albeit slowly.

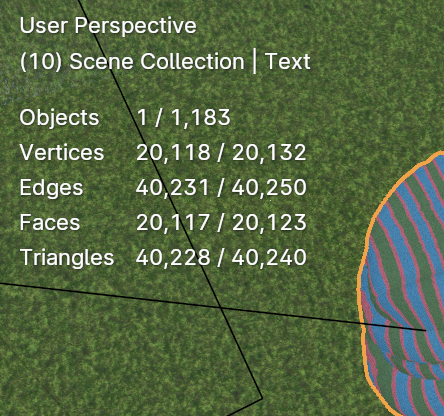
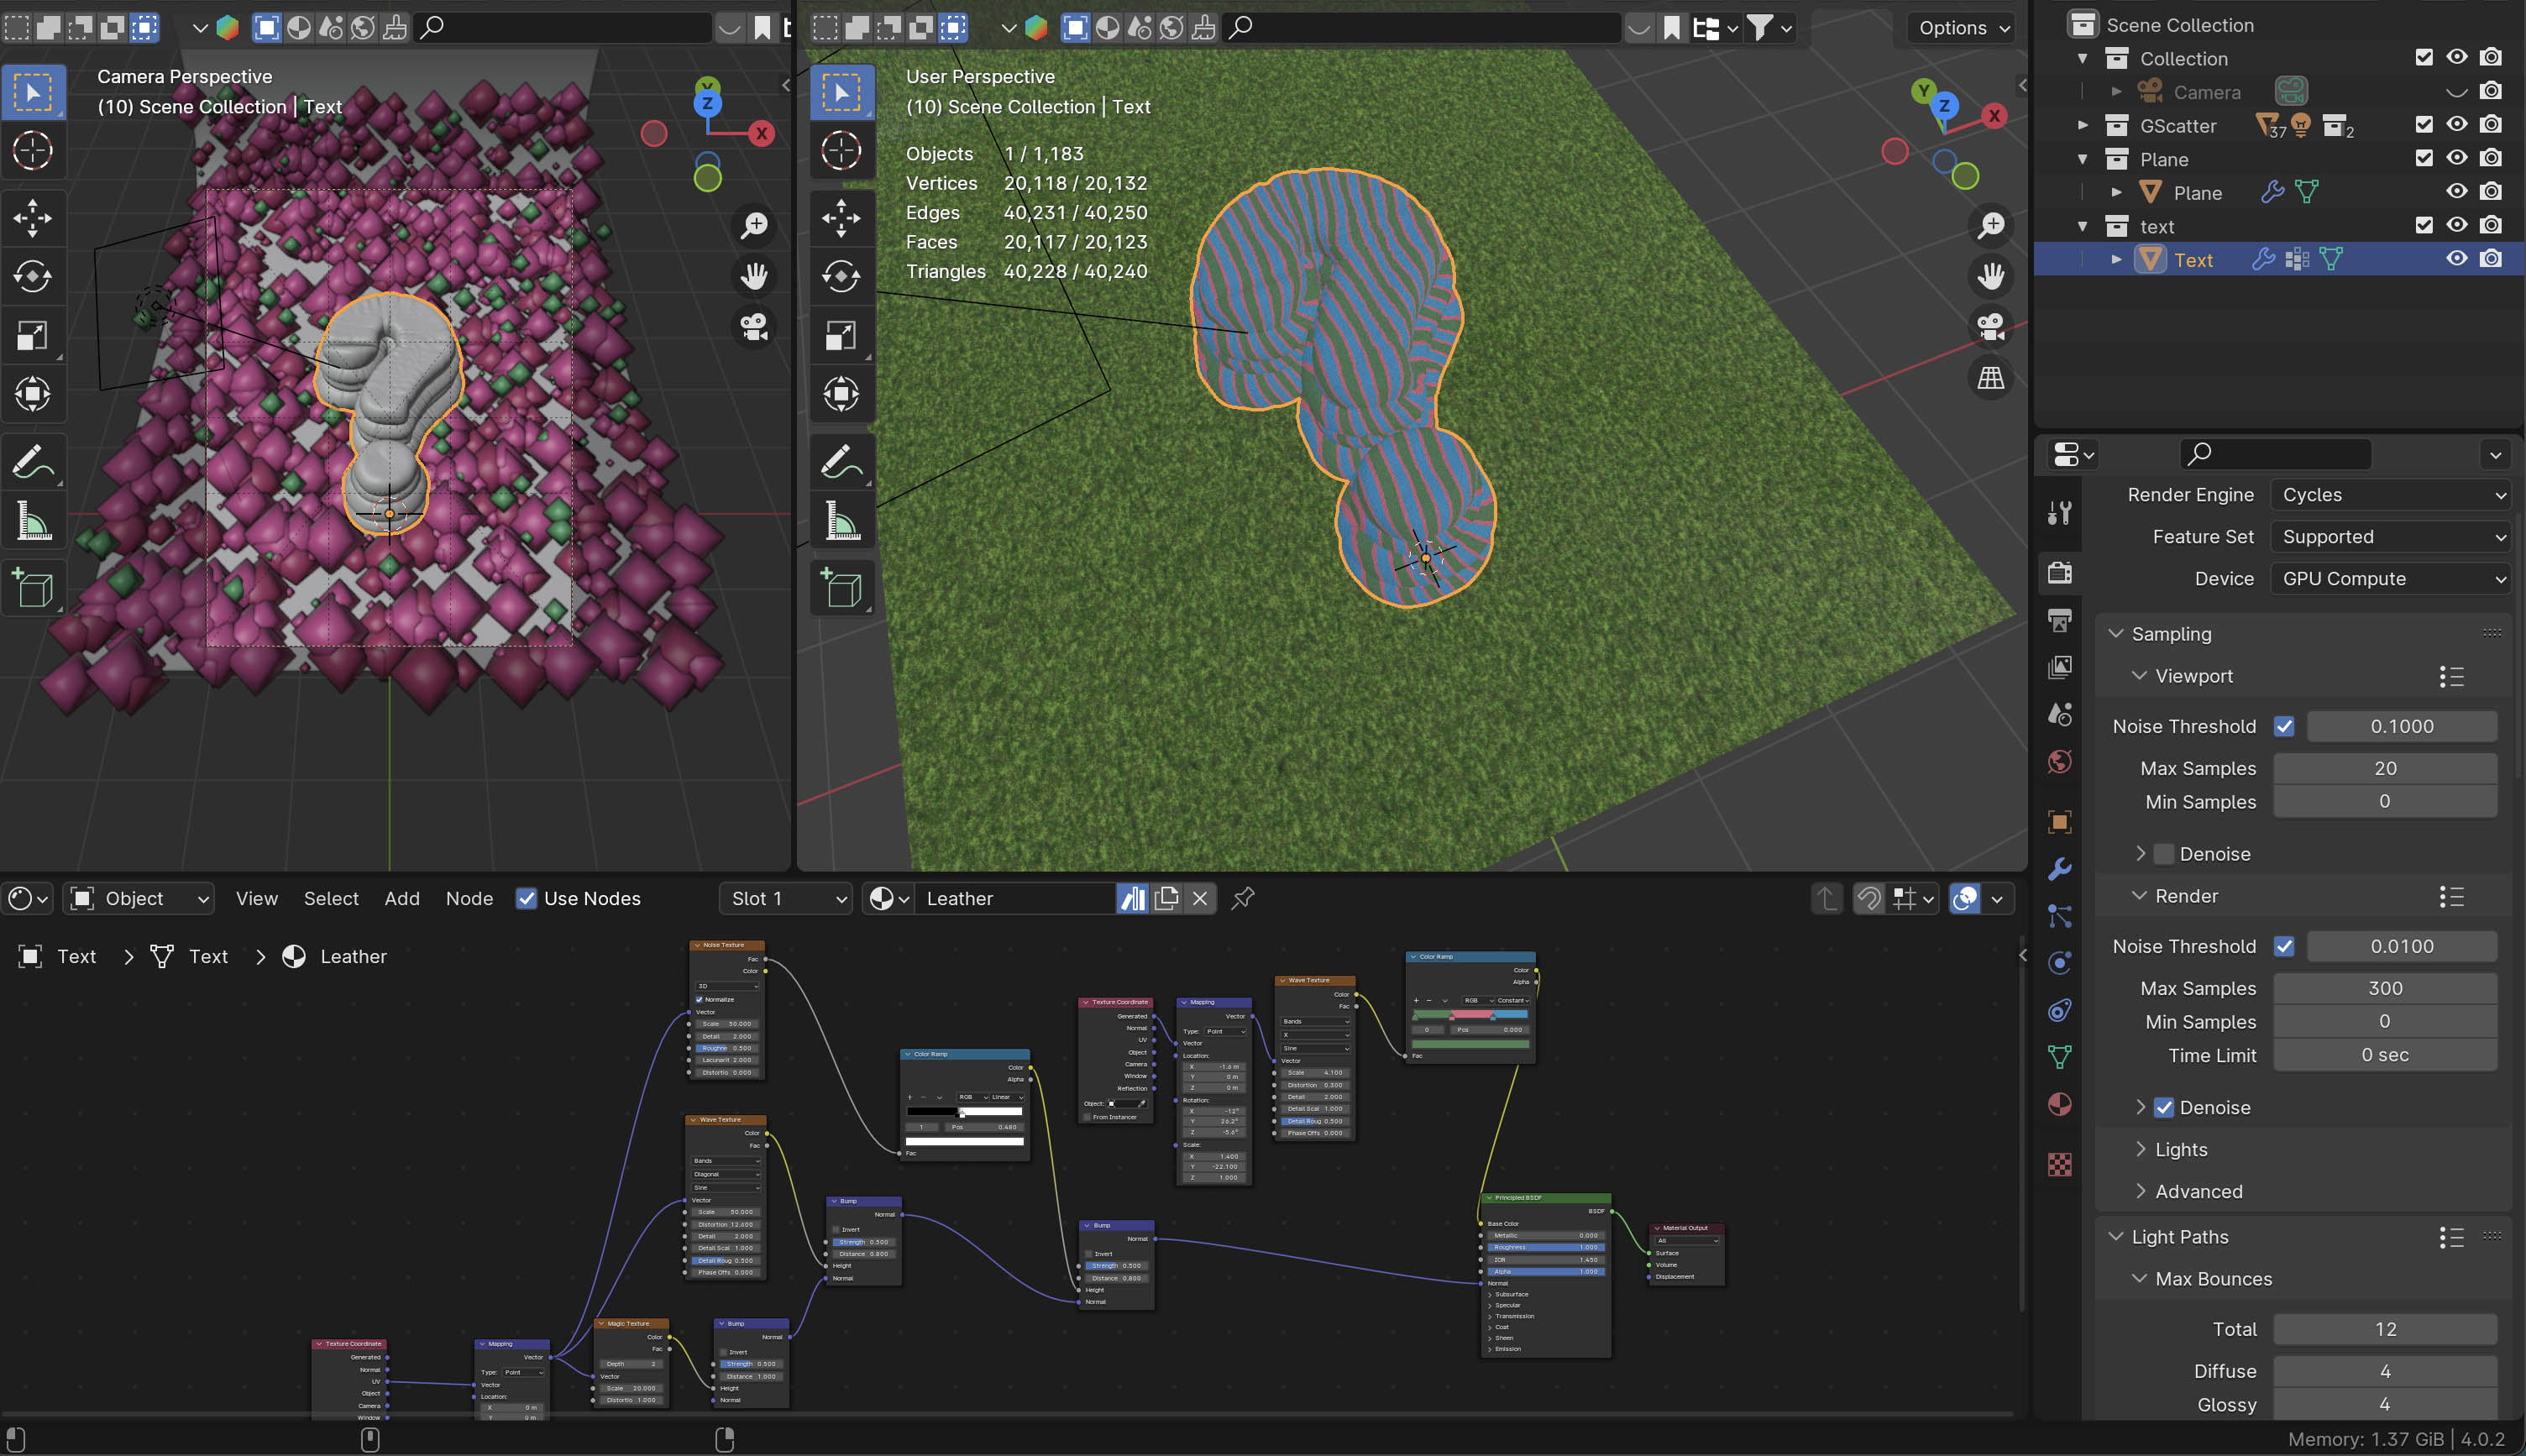
I am encountering some difficulties with a specific project: rendering an inflation animation. Although the scene is relatively simple, it involves cloth inflation (approximately 20,000 vertices). I'm also using the Gscatter addon, which is why I'm not able to use SheepIt. Even after disabling the Gscatter collection and rendering only the cloth inflation, my GPU still runs out of memory.

I'm struggling to understand why my GPU lacks enough memory. I have ensured that all other applications and software are closed + I have restarted my laptop. I've attempted to optimise the scene as per my understanding.

Could I have unknowingly changed a setting that is consuming a lot of memory / something else? Any tips on how to manage this, or is it best to wait until I have a better system for cloth simulations?

enter image description here

enter image description here

My subject has around 20k vertices, which is likely on the higher side but should still be manageable. Also, the materials for both the plane and the subject are node-based. I can simplify nodes (since a lot of the details from my cloth are blurred out) but I'm not sure if that'll help GPU either.

I'm making this post to ensure that I'm not making a fundamental mistake and that the issue lies with my current system's limitations.

Edit: I also have 300 samples per image and 150 frames but as far as I understand, this doesn't use GPU. Just takes longer.

I tried using my CPU overnight and it was able to render 9 frames in 8ish hours.

Worst case scenario, i will look up rendering in layers since my grass layer remains the same (unfortunately) while only the cloth expands/ inflates.

$\endgroup$

1 Answer 1

4
$\begingroup$

You have a scene that requires a lot of memory, because you have a lot of things in it. It's that simple the way I see it. Memory runs out quickly when you have a lot of something(like instances). Instancing is a clever way to save memory when rendering and it does save enormous amounts of it and makes things possible that would otherwise not be, however, saving memory doesn't mean not using any at all and instances do still use a lot of memory.

Don't forget that information is not only stored, but also processed so various processes(like rendering) may require considerably more memory than just what it takes to store the geometry. If you want to render scenes that have lots of things like grass, hair, fur, particles, trees, leaves, surface displacement detail and things like that, you do need a lot of memory and it should not be surprising you are running out of it if you have things like that in your scene.

It's difficult to know exactly how much memory a scene will use(and you have not even provided any specific detail about yours) so it might not be a bad idea to base your decisions on tests. You already have tested your current scene and the result is that you run out of memory. That's it. It is for a fact too big for your hardware. No need to doubt it. The only thing you can do from here is to attempt to optimize it. A few things to consider:

  • Open viewports use VRAM. If you have Material Preview mode, textures and shaders and geometry and all the other stuff in your scene is also loaded to memory. Some things are also cached and that memory is not fully freed if you simply switch to wireframe mode(I have tested). You could save the file with viewports closed, close Blender and reopen and then less VRAM will be used. But this is a bit inconvenient, so you may consider not having Blender's UI loaded at all when rendering. You can do that with Command Line Rendering

  • Textures may use lots of memory. You could inspect image files used in your scene to see if you could maybe use lower resolution. If they are from many different locations, you could pack images (File -> External Resources -> Pack Recources) and then unpack them to one folder. Keep in mind that images may be compressed on your storage disk and they do need to be uncompressed in VRAM when rendering, so you should direct your attention to the resolution, not to the file size. Note that HDRI lighting is one very commonly used thing that usually requires or at last may have one very large high dynamic range(32bit per channel) image file - worth to check that one. When deciding the needed resolution, it's helpful to consider the size of the textures or parts of them visible in your rendered image relative to its resolution.

  • Geometry may use a lot of memory. If you have lots of it. Try having less. Maybe you don't need some objects in your scene, maybe some are too small on screen and don't need as much detail. Consider modifiers as well - Subdivision Surface modifiers can increase the amount of geometry drastically very quickly and they also have different settings for the viewport and for rendering, so it may not be apparent. Another example is Geometry Nodes modifiers - they can do anything including completely overloading your scene with geometry with only a few "right" nodes.

  • Particles, instances, hair, fur, displacement use a lot of memory. Maybe lower the density or the complexity. Maybe a transparent triangular plane with 3 verts with a picture of it is enough for a grass strand or even a clump of grass instead of something that has hundreds of verts.

  • The result of the image being rendered needs to be stored in memory as well. This is not a problem in most cases, unless you are rendering large resolution images with lots of render passes. 4K or larger images with 10-15 render passeses(like light passes + a few extra like denoising data, cryptomatte, Z...) will add up to quite a large size in memory, all the passes are in 32bit float format after all. If that was the case, it would be logical to consider enabling "Use Tilling" under Memory section, Performance tab in the Render properties(Properties Editor). This can significantly reduce memory usage in those cases. Persistent Data setting also influences memory.

$\endgroup$
1
  • $\begingroup$ Thank you! All of this is very helpful, I'm going to go through them one by one on my scene to improve it. $\endgroup$
    – Der8
    Commented Jun 13 at 12:56

You must log in to answer this question.

Not the answer you're looking for? Browse other questions tagged .