2
$\begingroup$

I am loading the data of a line from a csv file to create a curve. If I animate the curve by keyframing the "factor end" property in the UI, I get the visual animation I want, but the mapping doesn't work, since my path is traversed with a (known - I can generate that csv data, if needed) different speed. However, in the csv data, each point is 1/50 s after the next, and I want to "extend"/animate the curve using this information.

1st I've tried the UI with all 3 "end factor mappings", but none let me specify more in detail. Since the points are a constant time-duration apart, I would just need a "show 1 point per frame" option, but this didn't work for the 3 mappings, that I can choose from the menu. Only start and end points are synchronized to my other motion, of which I know it's correct. Maybe the problem is with my path settings? -> see below in the script, how I generate/set the path.

2nd Another idea is to keyframe when loading the data in python directly. I've tried modifying my loading/curve generation script:

import bpy # blender python API
import csv

# create the Curve Datablock
curveData = bpy.data.curves.new('myCurve', type='CURVE')
curveData.dimensions = '3D'
curveData.resolution_u = 1

curveData.bevel_depth = 0.002 # m thickness of the path in m
curveData.bevel_resolution = 10
curveData.use_fill_caps = True # the rounded line should not be hollow

# map coords to spline
polyline = curveData.splines.new('POLY')
polyline.use_endpoint_u = True

curveOB = bpy.data.objects.new('myCurve', curveData)

bpy.context.collection.objects.link(curveOB)

#with open('/home/mike/Documents/ownCloud/3D/blender/data/p_err_2.csv') as csvfile:
with open('/home/mike/Documents/ownCloud/3D/blender/data/p_ref.csv') as csvfile:
    readcsv = csv.reader(csvfile, delimiter=',')
    k = 0
    for i, row in enumerate(readcsv):
      if (i % 1) == 0:
        if k != 0:
            polyline.points.add(1)
        polyline.points[k].co = (float(row[0]), float(row[1]), float(row[2]), 1)
        k += 1
        polyline.points[0].keyframe_insert('co',frame=k)

but the keyframes - if I undestand correctly - just place the points where they already are .. But I wanted them to appear at this keyframe.

Is there a way to change the "end factor" mapping, that reveils points by a constant time difference? Is this something that could be achieved with fcurves? Or is there a way to repair my loading keyframe thing?

3rd I've now also tried to use Geometry nodes and the combination of the

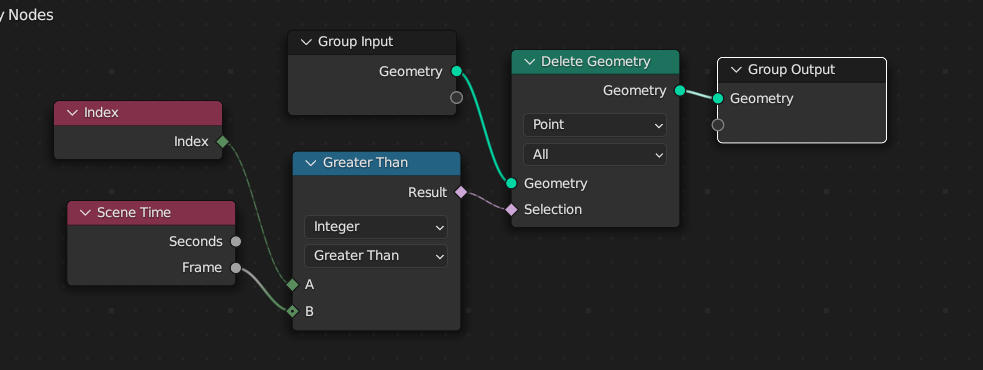
Index -> Greater Than -> Delete Geometry (Point)

will delete the Verticies of the curve object, rather than the points that defined the curve. If I use Spline Parameter instead of Index, either the whole curve is removed with negative values, or it is displayed in full with values greater than zero.

4th I've tried this "hide" property of the points, but it's apparently not used to eliminate the effect of the control point?

points = curveOB.data.splines.active.points
# Loop through and hide points up to the specified index
for i, point in enumerate(points):
    if i <= 5:
        point.hide = True
        point.keyframe_insert(data_path="hide", frame=2)
    else:
        point.hide = False
        point.keyframe_insert(data_path="hide", frame=3)

# Update the curve object
bpy.context.view_layer.update()
$\endgroup$
2
  • $\begingroup$ You could use geonodes to delete every point with index higher than current frame number… $\endgroup$ Commented Oct 23, 2023 at 19:52
  • $\begingroup$ I've tried to achieve what you suggested and it seems very plausible, but I couldn't get it to work with my experiments -> see last edit of the question. $\endgroup$
    – mike
    Commented Oct 27, 2023 at 16:09

2 Answers 2

1
$\begingroup$

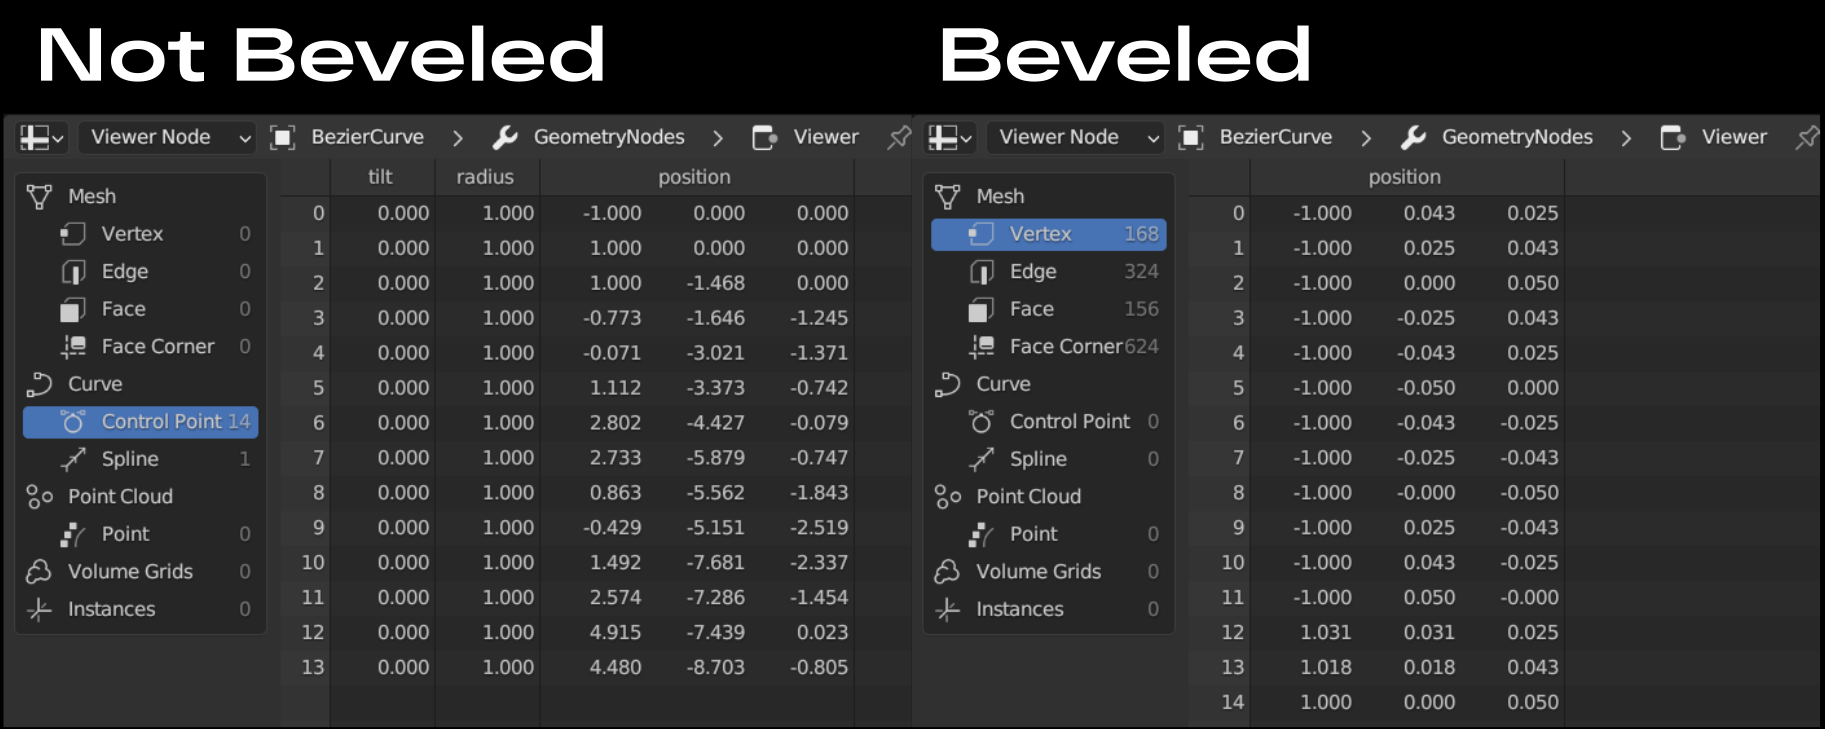
Once you have your curve beveled, it becomes a mesh and in Geometry Nodes it is considered to be a mesh.

enter image description here

So you have to remove bevel_depth to keep it as curve, and then you can use it as curve in Geometry Nodes:

enter image description here

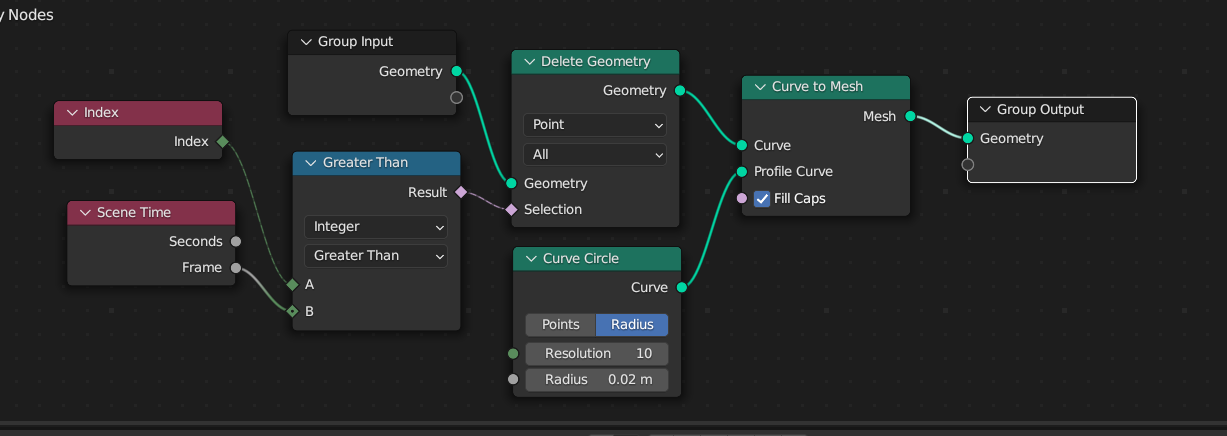
When you see the desired effect, you can add beveling after removing control points:

enter image description here

$\endgroup$
1
  • $\begingroup$ Thank you for the clarification! I'm sure this is a valid solution as well! Meanwhile I've managed to achieve what I needed in python, which is a very convenient way for me, since I only need to load the file similar to the other measurements, that I have. $\endgroup$
    – mike
    Commented Oct 29, 2023 at 10:54
0
$\begingroup$

Actually I found a solution using python:

I've added points for all datapoints in the csv file. First I set the position of all points to the first point. Next, I animate their position, such that all "not shown" points move with the next point to be shown.

import bpy # blender python API
import csv

# create the Curve Datablock
curveData = bpy.data.curves.new('myCurve', type='CURVE')
curveData.dimensions = '3D'
curveData.resolution_u = 1

curveData.bevel_depth = 0.002 # m thickness of the path in m
curveData.bevel_resolution = 10
curveData.use_fill_caps = True # the rounded line should not be hollow

# map coords to spline
polyline = curveData.splines.new('POLY')   
curveOB = bpy.data.objects.new('myCurve', curveData)
bpy.context.collection.objects.link(curveOB)

data_path = '<file>/data.csv' 
with open(data_path) as csvfile:
    readcsv = csv.reader(csvfile, delimiter=',')
    k = 0
    for i, row in enumerate(readcsv):
        if i == 0:
            # save the first value -> all points will be placed there at frame 0
            row0 = row
        if (i % 1) == 0:
            if k != 0:
                # add points for every value in the file
                polyline.points.add(1)
            # initialize all points at the row0 position at frame 0
            polyline.points[k].co = (float(row0[0]), float(row0[1]), float(row0[2]), 1)
            polyline.points[k].keyframe_insert('co', frame=0)
            k += 1
    
    # reset the file and reade from the start
    csvfile.seek(0)
    
    k = 0
    for i, row in enumerate(readcsv):
        if (i % 1) == 0:
            # place all following points at data position at frame k
            for m, point in enumerate(polyline.points):
                if m >= k:
                    point.co = (float(row[0]), float(row[1]), float(row[2]), 1)
                    point.keyframe_insert('co',frame=k)
            k += 1
$\endgroup$

You must log in to answer this question.

Not the answer you're looking for? Browse other questions tagged .