2
$\begingroup$

I'm looking for a node setup that uses noise/musgrave/image textures to control the density of scatter systems set up in Geometry Nodes. I've looked at several tutorials, but they only seem to show how to set a random float value for scaling and use vertex painting to select where the distribution should take place. I would much prefer to be able to use textures for the distribution to get a more organic feel.

Has anyone done this before and shown how to do it?

$\endgroup$
2
  • 1
    $\begingroup$ maybe i misunderstood your question, but why don't you just put the musgrave output in the density input (maybe with math multiply in between)? $\endgroup$
    – Chris
    Commented Oct 23, 2022 at 7:36
  • $\begingroup$ If your question has been solved, please be so kind and mark the answer that contributed to the solution as "Accepted answer". This will make it easier for others to see which path leads to the solution, and the question will no longer show as unsolved. Thank you! Here you can find more information: What should I do if someone answers my question?. If you still haven't gotten a solution to your question, please be kind enough to address it. $\endgroup$
    – quellenform
    Commented Nov 3, 2022 at 9:21

1 Answer 1

1
$\begingroup$

You have several ways to control the distribution of points here.

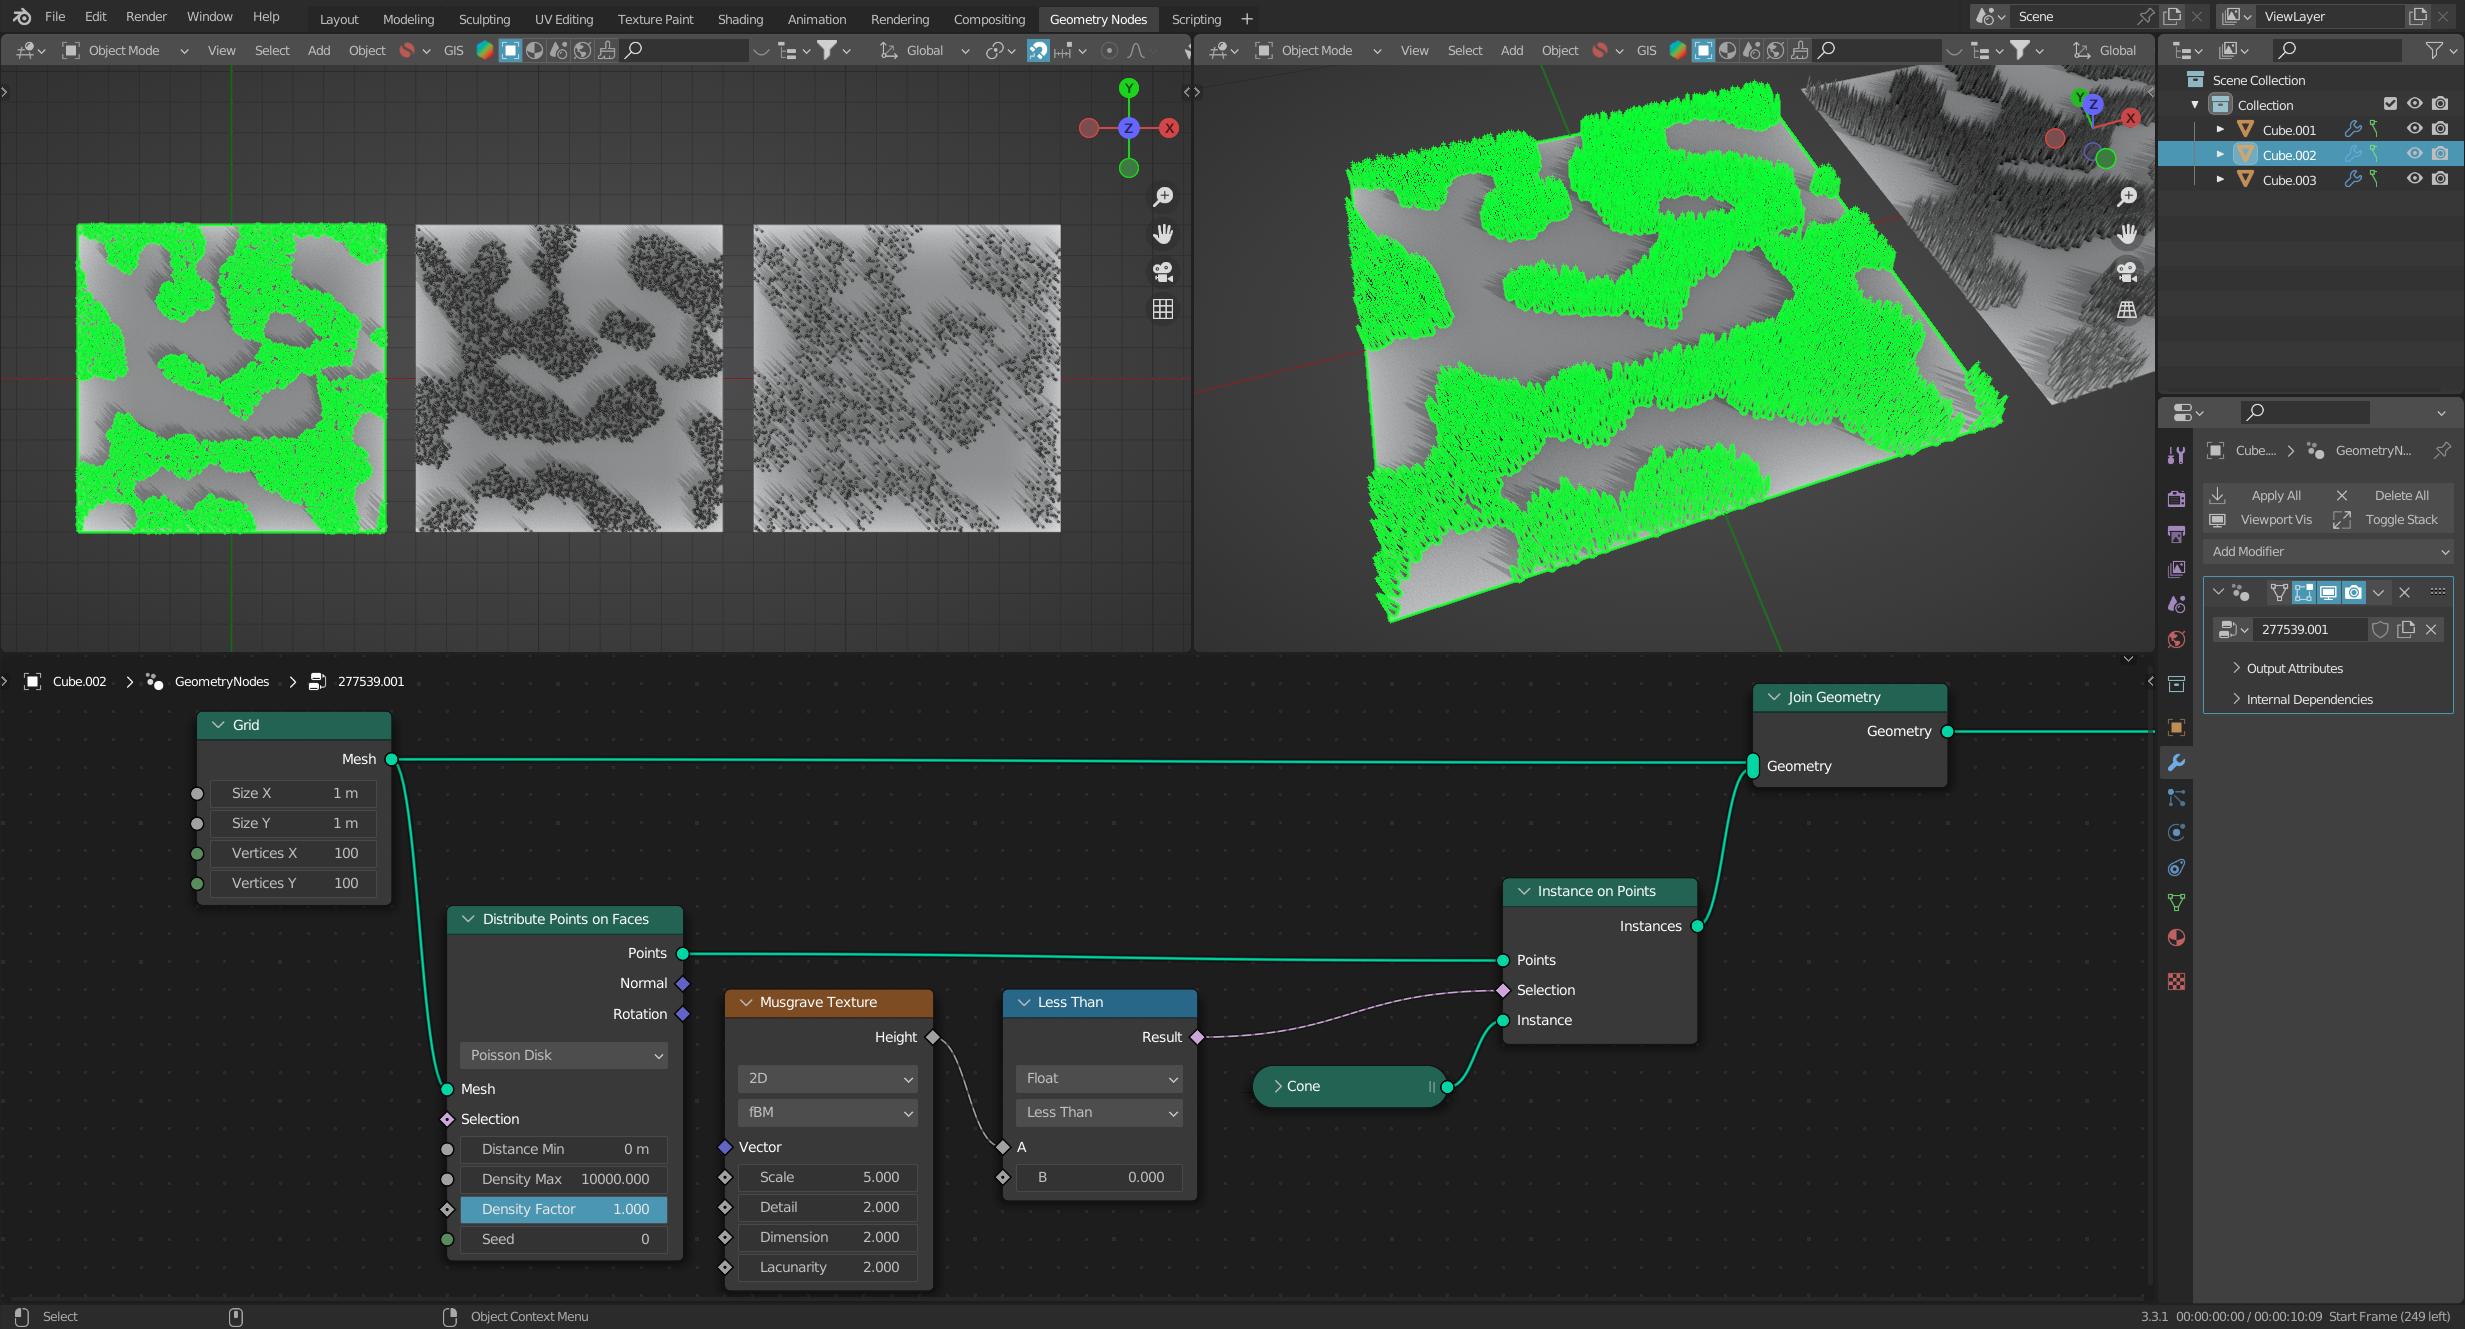
The most obvious would be to simply instantiate objects at the points that match a certain criterion. In this example, I use the Compare node to create a selection, and feed this selection directly into the Instance on Points node:
enter image description here

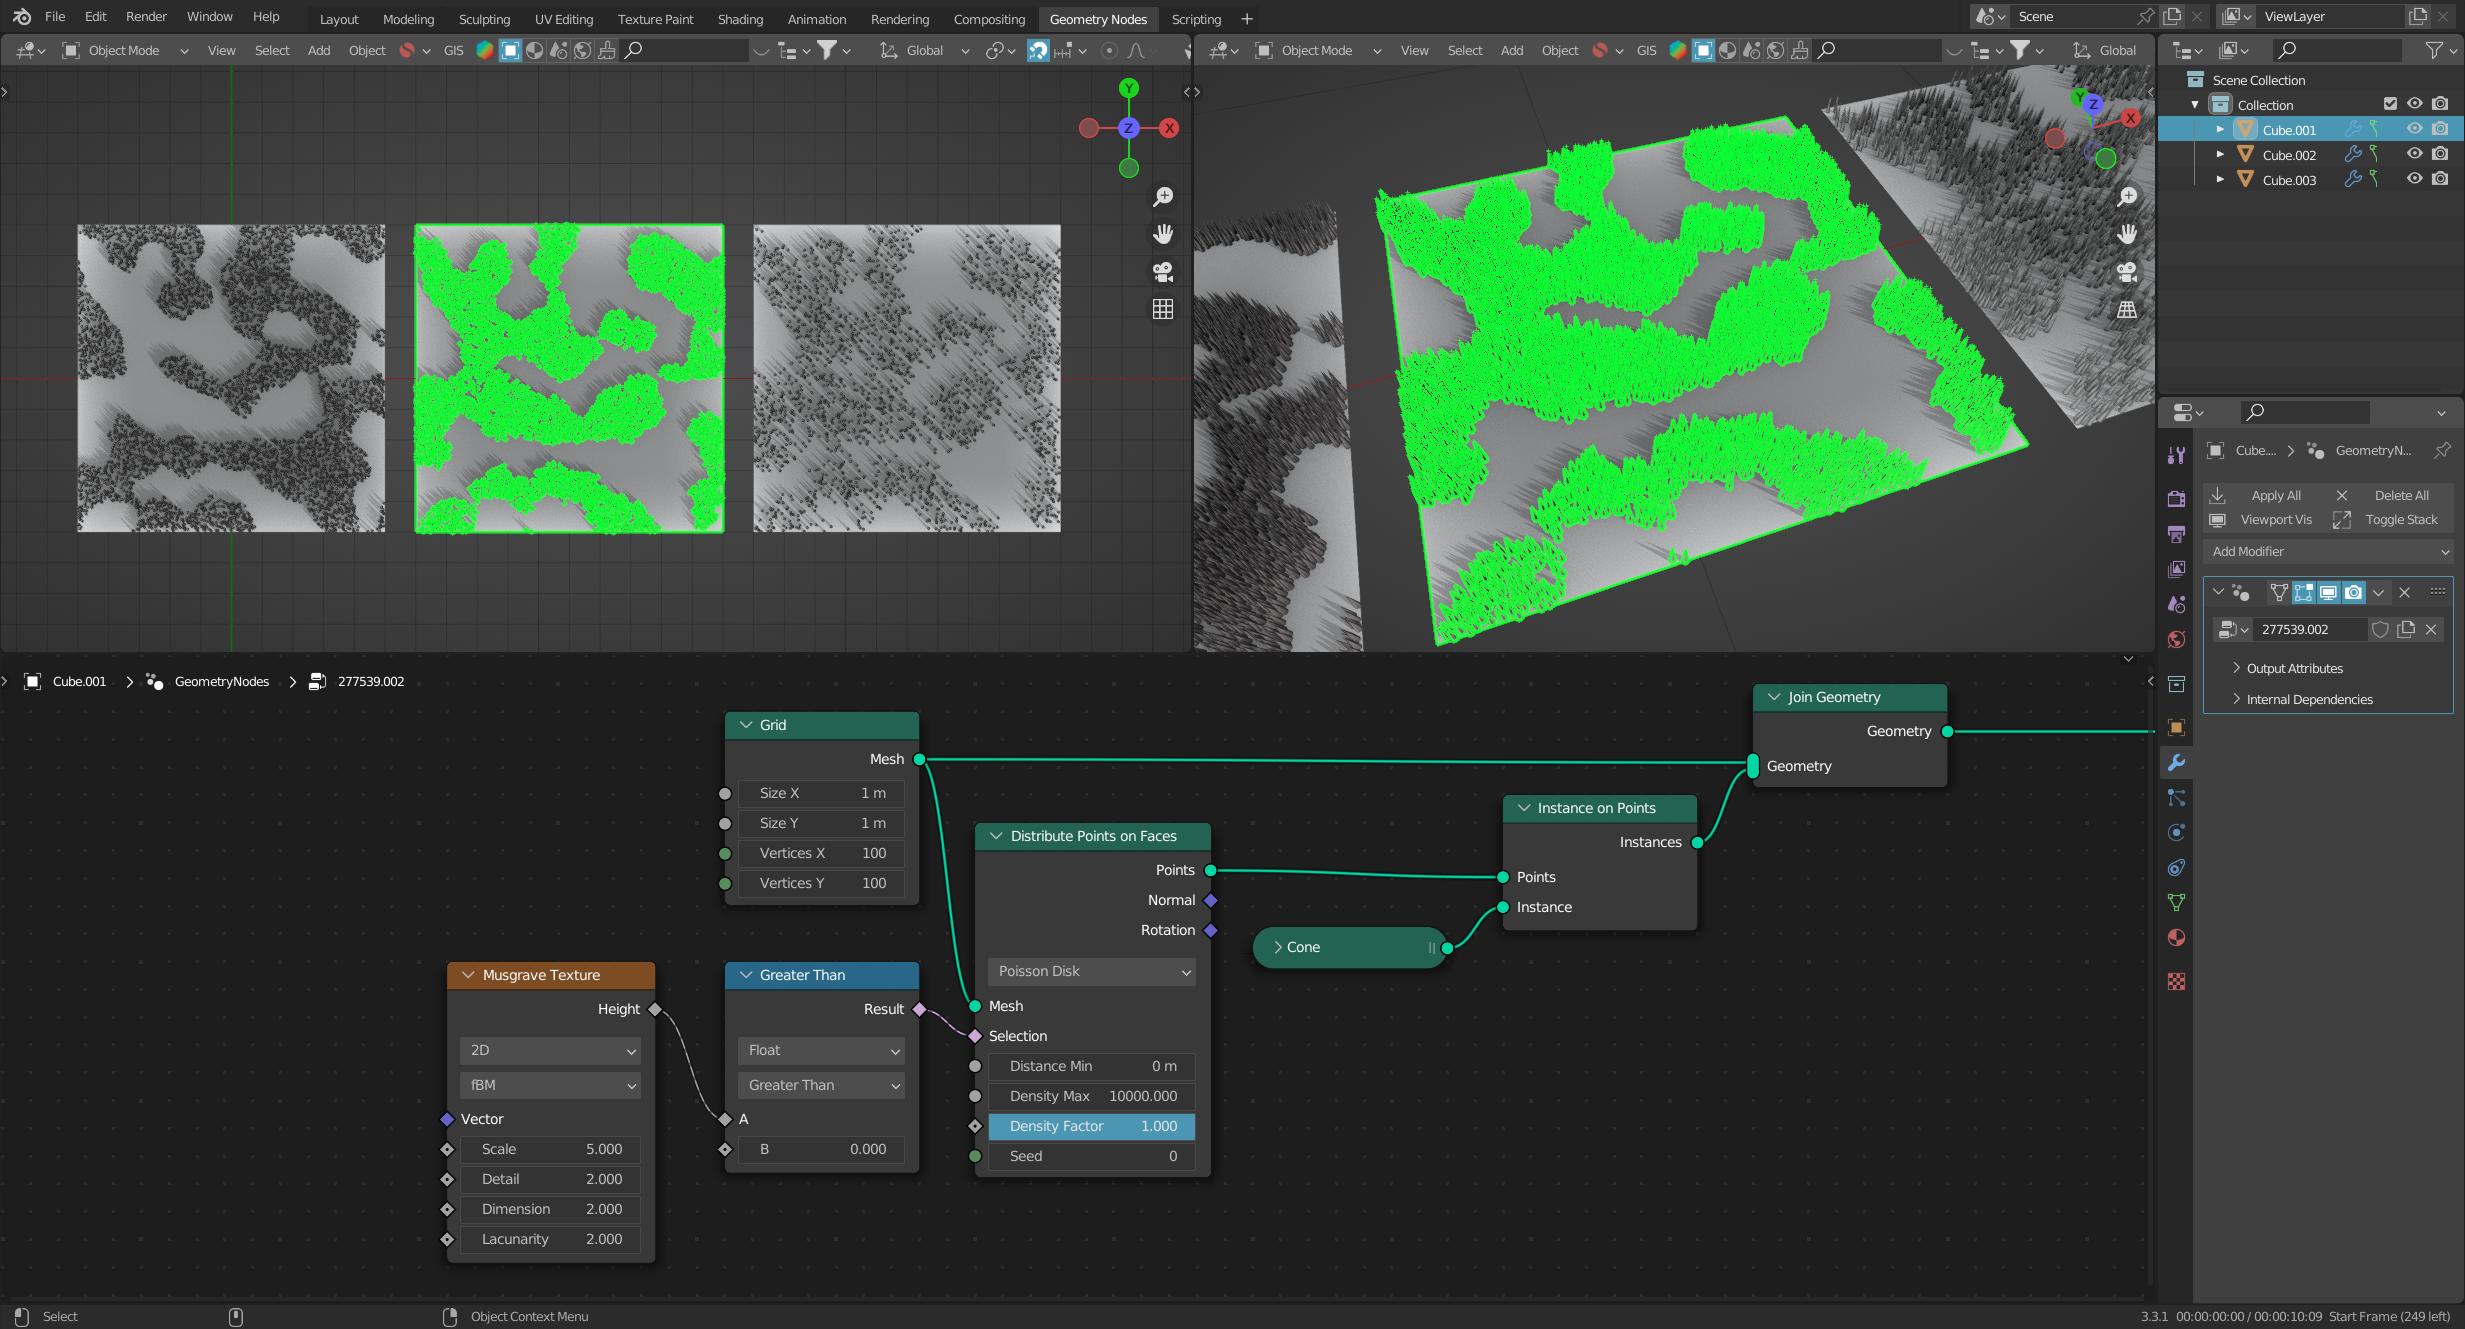
However, a better option would be to not create points where none should be used in the first place. In this example I use the selection directly when creating the points with Distribute Points on Faces:
enter image description here

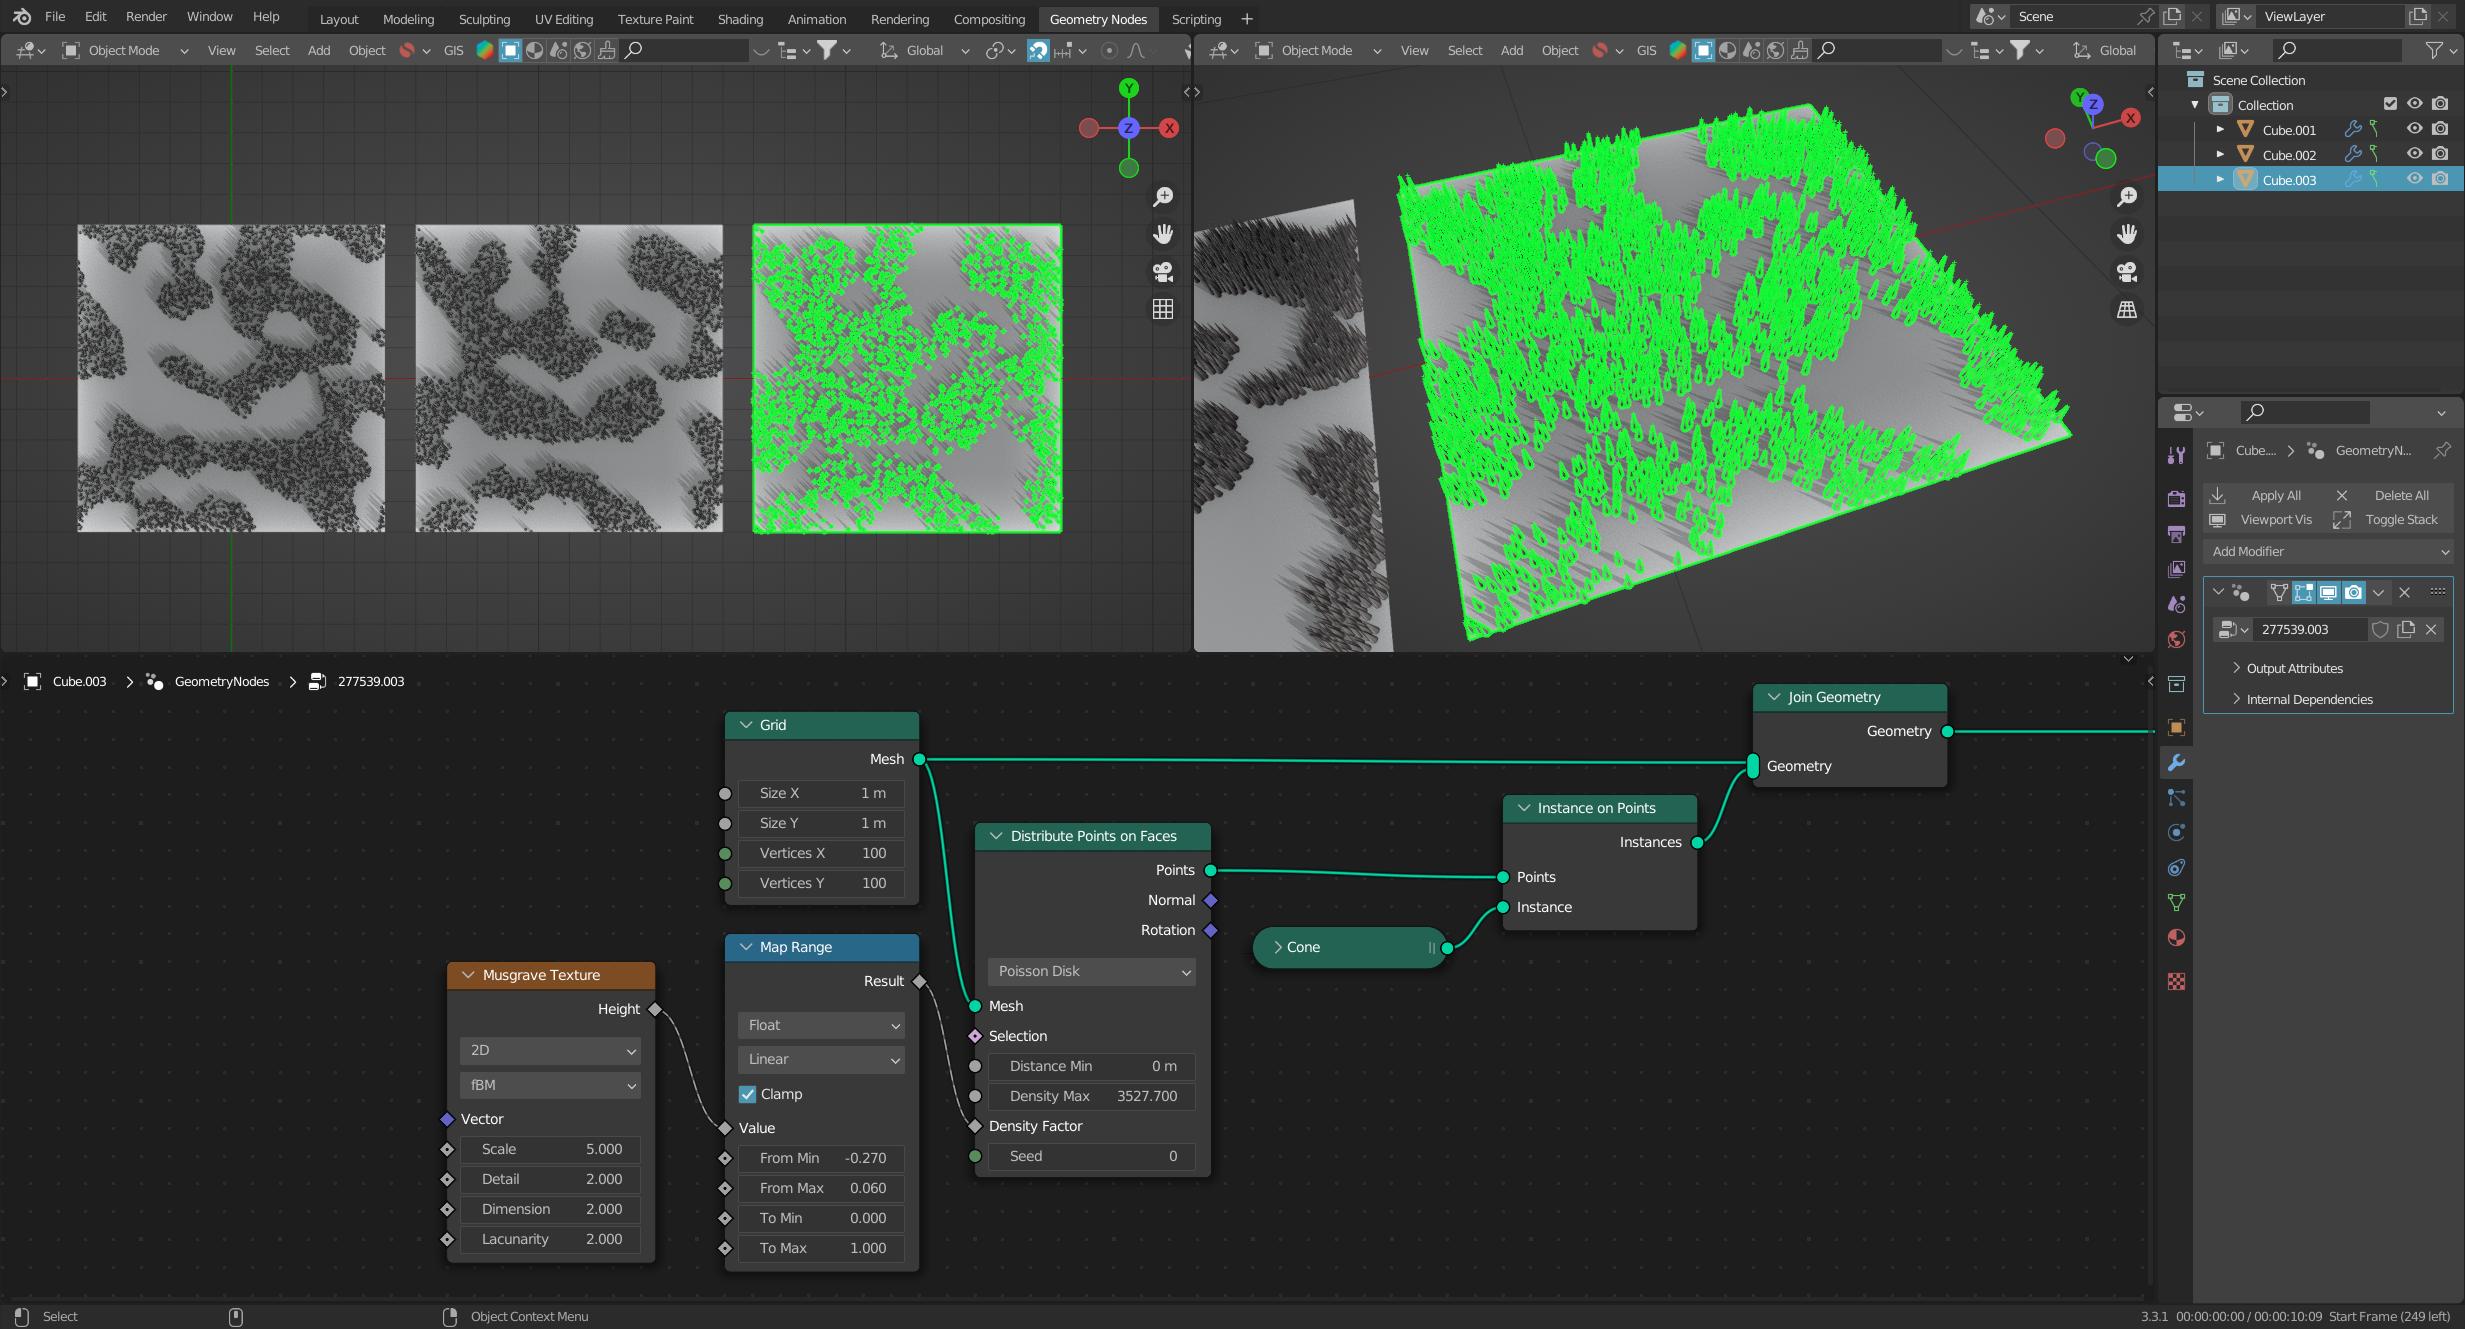
Another option would also be to use the value of the texture as the value for the density of the distribution, as @Chris has already correctly noted in the comments. This variant gives you a smoother distribution of points. Note here that the value for Density Factor is in the range $0-1$, which is why I use the node Map Range here:
enter image description here

Note: In the last two examples, the resolution of the grid is crucial, since the selection in the point distribution is based on the faces of the object!


(Blender 3.2+)

$\endgroup$

You must log in to answer this question.

Not the answer you're looking for? Browse other questions tagged .