1
$\begingroup$

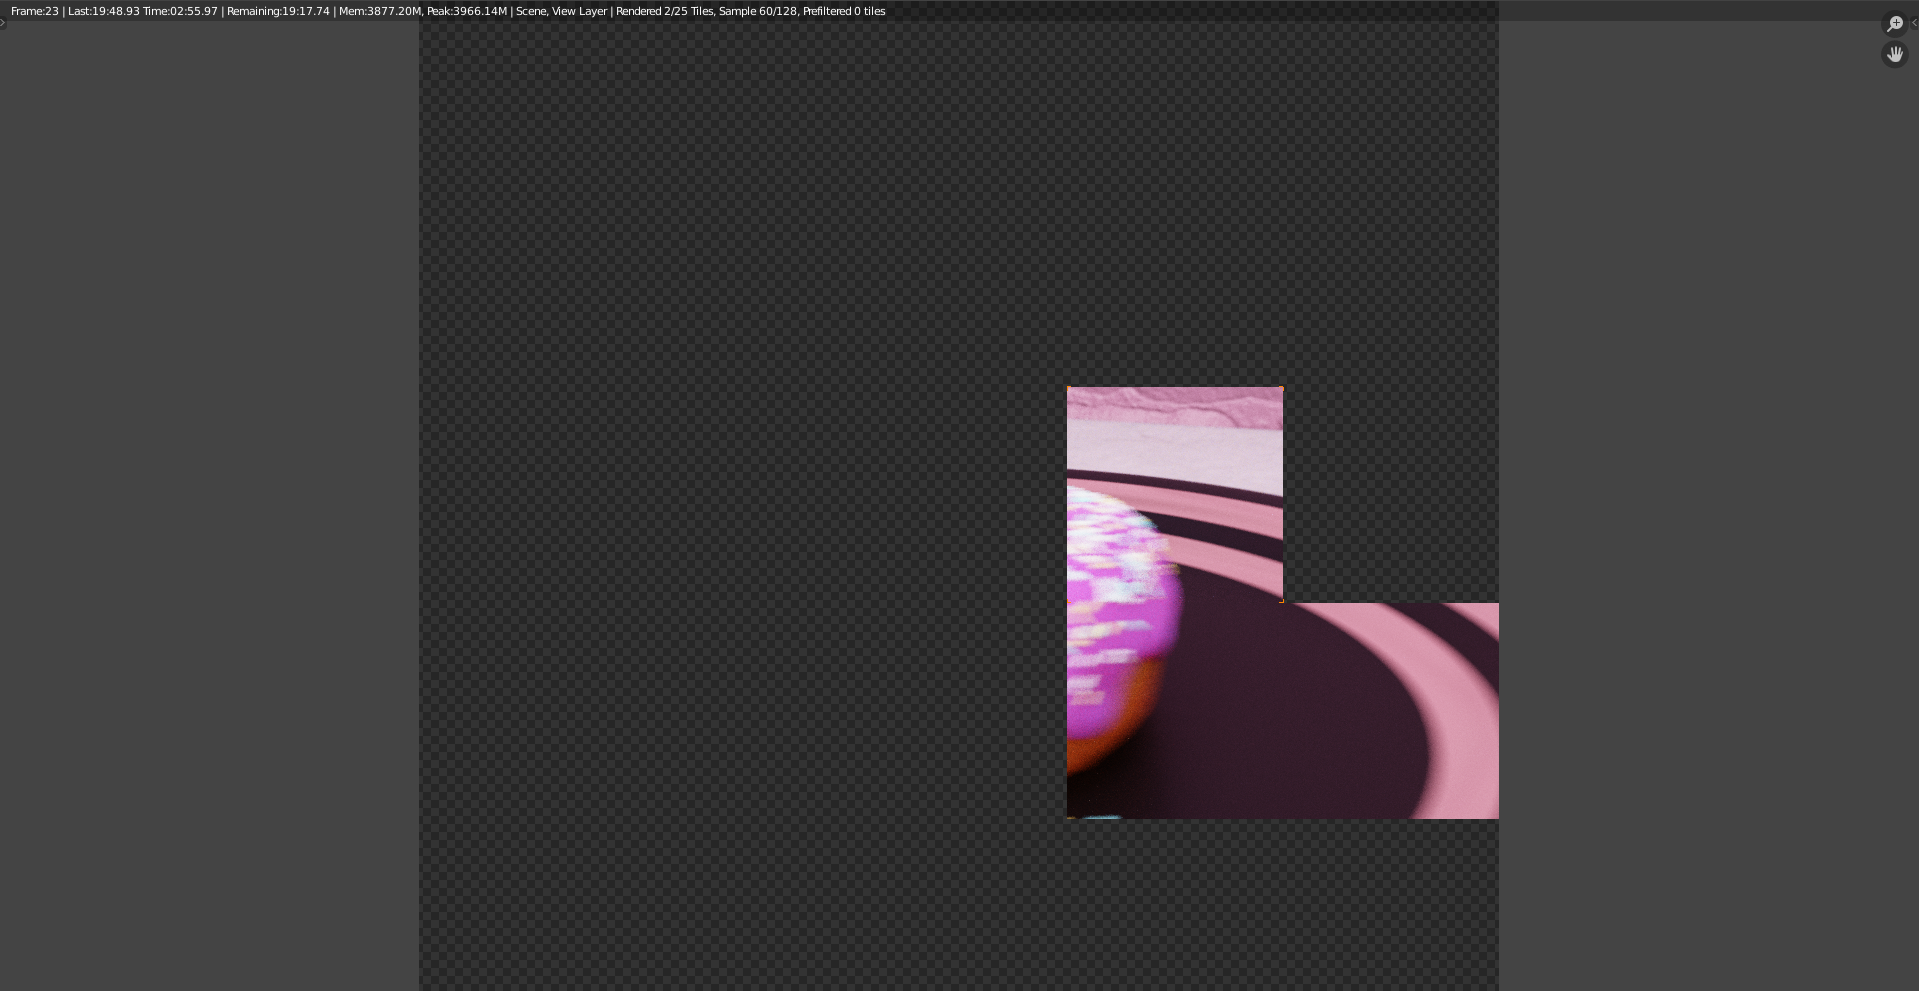
So I was doing the doughnut with cup of coffee scene from BlenderGuru's tutorials, when I tried rendering the animation (which was basically copied from what he did), it only took an hour maybe, but after some dedicated improvements that were made by myself, it takes half an hour to render one frame out of 160...

Of course I looked for solutions over the internet, I've tried changing sub samples and sampling options, messing around with tile rendering sizes, light paths and so on. These only saved me a couple of minutes, but it's just a simple scene or is this how it is with the life of rendering?

Just in case, when I added my own things, I wasn't even able to render anything properly, because Blender would just freeze my laptop and forced me to reboot it. So I fixed it by going to registry editor and increasing decimals for something. Maybe this is related with my slow rendering somehow?

My specifications:

  • Processor - Intel(R) Core(TM) i7-9750H CPU @ 2.60GHz 260GHz;
  • RAM - 8.00 GB (during rendering, it only uses ~500 MB);
  • The program is installed on SSD disc;
  • Windows 10 Home 64 bit (version 1809);
  • GPU - NVIDIA GeForce GTX 1650 6 GB.

My render image:

enter image description here

$\endgroup$
2
  • $\begingroup$ Render times are really vary depending on the scene you're trying to render and your hardware. Are you using Eevee or Cycles? Are you using GPU / CPU rendering? Are you adding volumetric lighting or complex particle systems? How many objects are in your scene? Etc. $\endgroup$
    – J. Chan
    Commented Apr 4, 2020 at 13:19
  • $\begingroup$ @J.Chan I'm using cycles, I tried both GPU and CPU, then CPU, and finally - GPU only, because for some reasons it renders faster that way. I don't use volumetric or particle systems. I have 12 objects, I can name those which are more complex: coffee liquid, metal spoon, reflective rings around the plate, glass cup and motion blur effect. $\endgroup$
    – lucutes
    Commented Apr 4, 2020 at 13:37

1 Answer 1

1
$\begingroup$

here you can find a way to check what area of the screen takes more to render: https://blenderartists.org/t/any-way-to-generate-a-render-time-heatmap/1161497

Render layers node is used in combination with Color ramp to show the longer pixels to render.

Another way to check what is slowing down your render is to disable all objects and re-enable one by one and check render time (and eventually crashed too).

$\endgroup$
9
  • $\begingroup$ Oh this is really cool :). Thanks for sharing the link. $\endgroup$ Commented Apr 4, 2020 at 14:33
  • $\begingroup$ I tried to do the heat map thing but I dunno why it won't work - imgur.com/a/1ontNDJ $\endgroup$
    – lucutes
    Commented Apr 4, 2020 at 19:18
  • $\begingroup$ it's working, but you just need to reduce the size of the render tiles (render properties > performance > tiles X & Y) to see more details $\endgroup$
    – Sanbaldo
    Commented Apr 5, 2020 at 0:19
  • 1
    $\begingroup$ @sanbaldo So I've just lowered the tile sizes from 256 to 16 and when I hit F12 for render, the whole screen went black and I was forced to reboot my laptop. Something is really clogging the program, so I'll do the last step by re-enabling objects. $\endgroup$
    – lucutes
    Commented Apr 5, 2020 at 17:30
  • $\begingroup$ ugh, so I tried rendering every single object, the speed was lightning fast, but when I combined them all into one scene again, it rendered all of it in half an hour again... $\endgroup$
    – lucutes
    Commented Apr 5, 2020 at 18:50

You must log in to answer this question.

Not the answer you're looking for? Browse other questions tagged .