17
$\begingroup$

I've got a pretty complicated node tree which isn't behaving exactly as I'd like. I'm pretty sure I've made some mistakes in my math nodes..

I'm interested in the output values of the math nodes. The best solution I've currently got is hooking the up to a color ramp, an emission shader, and rendering them on something.

Question: Is it possible to query the output value of math nodes, directly in the node editor? It'd be great to not have to render and deduce the values by their color.

$\endgroup$
2
  • $\begingroup$ I guess that you talk about the material node tree editor? $\endgroup$ Commented May 24, 2014 at 17:43
  • $\begingroup$ Yep, that's the one.. $\endgroup$
    – ajwood
    Commented May 24, 2014 at 18:14

3 Answers 3

10
$\begingroup$

You should activate the plugin "Node Wrangler" (it's awesome). Beside offering many Shortcuts and hotskeys it also offers to view every? possible output. To enable it open File > User Preferences...Ctrl+Alt+U and go to the Addons section. Search for "Node Wrangler":

Enable Node Wrangler

Next you can go into your node editor and Ctrl+Shift+Left Mouse-click on the output node of your choice. It should have created a Viewer-node that is linked between the selected node and the Material Output.
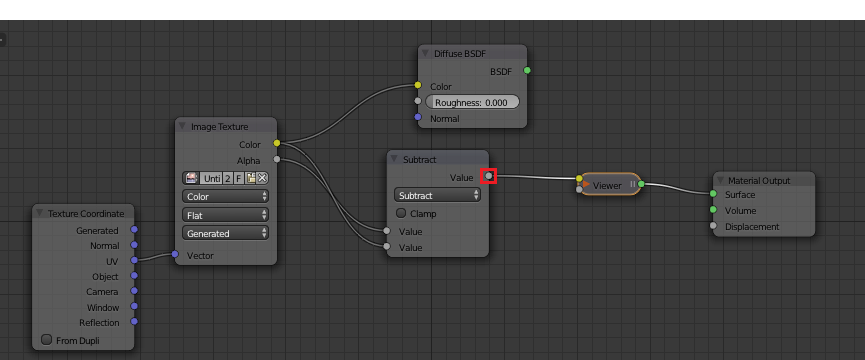
Add Viewer Node

You can now view the output from the node in any 3d-Viewport after switching to Viewport-Shading Rendered. To render faster you can switch to Object-Local-view. Just select the object you want to view and press Numpad /. This will temporarily disable all other objects and speed up the preview rendering. (If you don't have a Numpad, the setting can be found under View > View Global/Local)
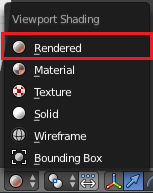
Switch to Rendered Mode

Note: This plugin also offers much functionality. Just press Ctrl+Space in the Node Editor to see it for yourself.

$\endgroup$
9
  • 1
    $\begingroup$ This definitely makes my current debugging strategy easier.. but I'd really like to be able to see the values as text. $\endgroup$
    – ajwood
    Commented May 24, 2014 at 23:36
  • 2
    $\begingroup$ Yeah.. I suppose it doesn't make sense if there is UV stuff or texturing going on.. however I've got values that are constant across the whole surface, and I don't know exactly what those values are. $\endgroup$
    – ajwood
    Commented May 24, 2014 at 23:57
  • 1
    $\begingroup$ That's a good point! my issue though is that it doesn't look good, and I don't know why. I'm pretty sure I have a mistake in a math node (somewhere upstream of a mix shader), but I don't know which node is the culprit.. $\endgroup$
    – ajwood
    Commented May 26, 2014 at 13:42
  • 1
    $\begingroup$ I guess there can be UV/texture coordinate info that change the values across the object which ruins my idea.. In my particular case, the values should be constant across the whole object. $\endgroup$
    – ajwood
    Commented May 26, 2014 at 13:57
  • 2
    $\begingroup$ @ajwood By clicking on the image in the image editor/viewer after rendering, you can see the value. Screenshot of a use case. $\endgroup$
    – gandalf3
    Commented May 27, 2014 at 23:29
14
$\begingroup$

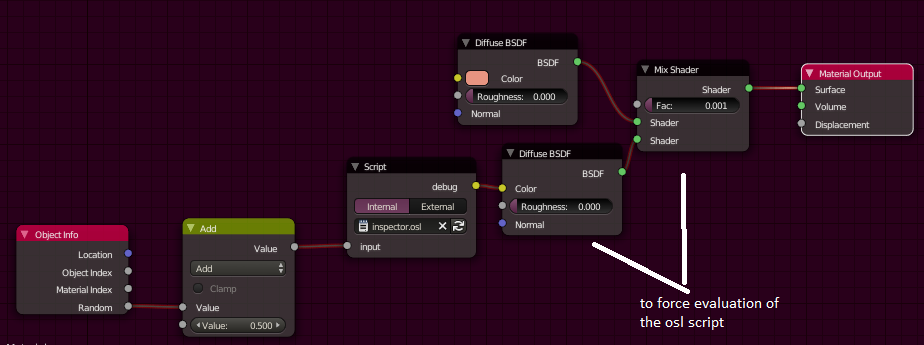
You could use a tiny OSL script to print the values calculated by the math nodes:

shader Inspector(float input=0,output color debug=0)
{
  debug = input;
  printf("%f" , debug );
}

The printf will print the input values to the console window.

You need to wire the output otherwise it wouldn't be evaluated (optimizer)

enter image description here

In order to use OSL scripts you need to:

  • Tick Open Shading Language in the render settings
  • Set Render device to CPU (GPU can't handle script nodes)

See What is wrong with this OSL shader?

For more tips on debugging osl see also this blog

$\endgroup$
6
  • $\begingroup$ I've tried doing this but I am not familiar with coding at all. Do I need to enter a command to get the actual value printed in the console? When compiling it nothing gets printed. $\endgroup$
    – buttr_toes
    Commented Feb 27, 2016 at 17:31
  • $\begingroup$ @VilkoL Simply paste the code snippet in a text editor and select the filename in a script node. Note that OSL must be enabled first and is only available when device is set to CPU the render setings. $\endgroup$
    – stacker
    Commented Feb 27, 2016 at 20:49
  • $\begingroup$ Yes I already did that but what is the trigger to make it print the value? Having it connected and hitting the refresh button on the script node doesn't print anything in the console. And yes, it is connected to the material output via an emission shader. What am I missing? $\endgroup$
    – buttr_toes
    Commented Feb 27, 2016 at 20:56
  • $\begingroup$ Cycles render would trigger the print statement from the 'shader' , Using this on a material would create huge console output. Perhaps it is better if you could ask another question and describe what you want to find out. $\endgroup$
    – stacker
    Commented Feb 27, 2016 at 21:31
  • $\begingroup$ Maybe I'm not being clear enough, sorry if this is the case. What I am trying to achieve is exactly what is asked in this question: to view the output from a math node within a material. When I said that it is connected to the material output via emission shader, I meant that I did the setup as provided in your picture above so it doesn't get ignored (optimizer), except with a simple emission shader rather than a diffuse mix. I did a render but still nothing is printed in the console. Are we talking about the same console? I'm talking about the window called "python console". $\endgroup$
    – buttr_toes
    Commented Feb 28, 2016 at 3:30
5
$\begingroup$

If the printf command doesn't print to the console, then the node is probably optimized away. To avoid this, you have to start blender from the console with a special setting.

In Windows you have to set the OSL_OPTIONS optimize to 0, e.g. open a command prompt in blender directory and type:

set OSL_OPTIONS=optimize=0
blender.exe

In Blender recompile your script.

This is only for debugging because it slows down the rendering!

$\endgroup$
2
  • $\begingroup$ I'm guessing the main confusion is that there are two consoles in Blender: one in the UI, and the other is the system console. The system console is where debug info gets printed from python scripts (not sure about OSL, but probably the same), but to see it one must open Blender from the console, or toggle it if running on MS Windows. (From Blender menu: Window -> Toggle System Console) $\endgroup$ Commented May 23, 2022 at 18:26
  • $\begingroup$ If this results in the printing of nothing, neither in Python Console or in System Console, then it maybe because the script isn't also connected to a shader input (green). This means the script can't be output into an AOV node. $\endgroup$
    – Unknow0059
    Commented Jan 12 at 8:06

You must log in to answer this question.

Not the answer you're looking for? Browse other questions tagged .