0
$\begingroup$

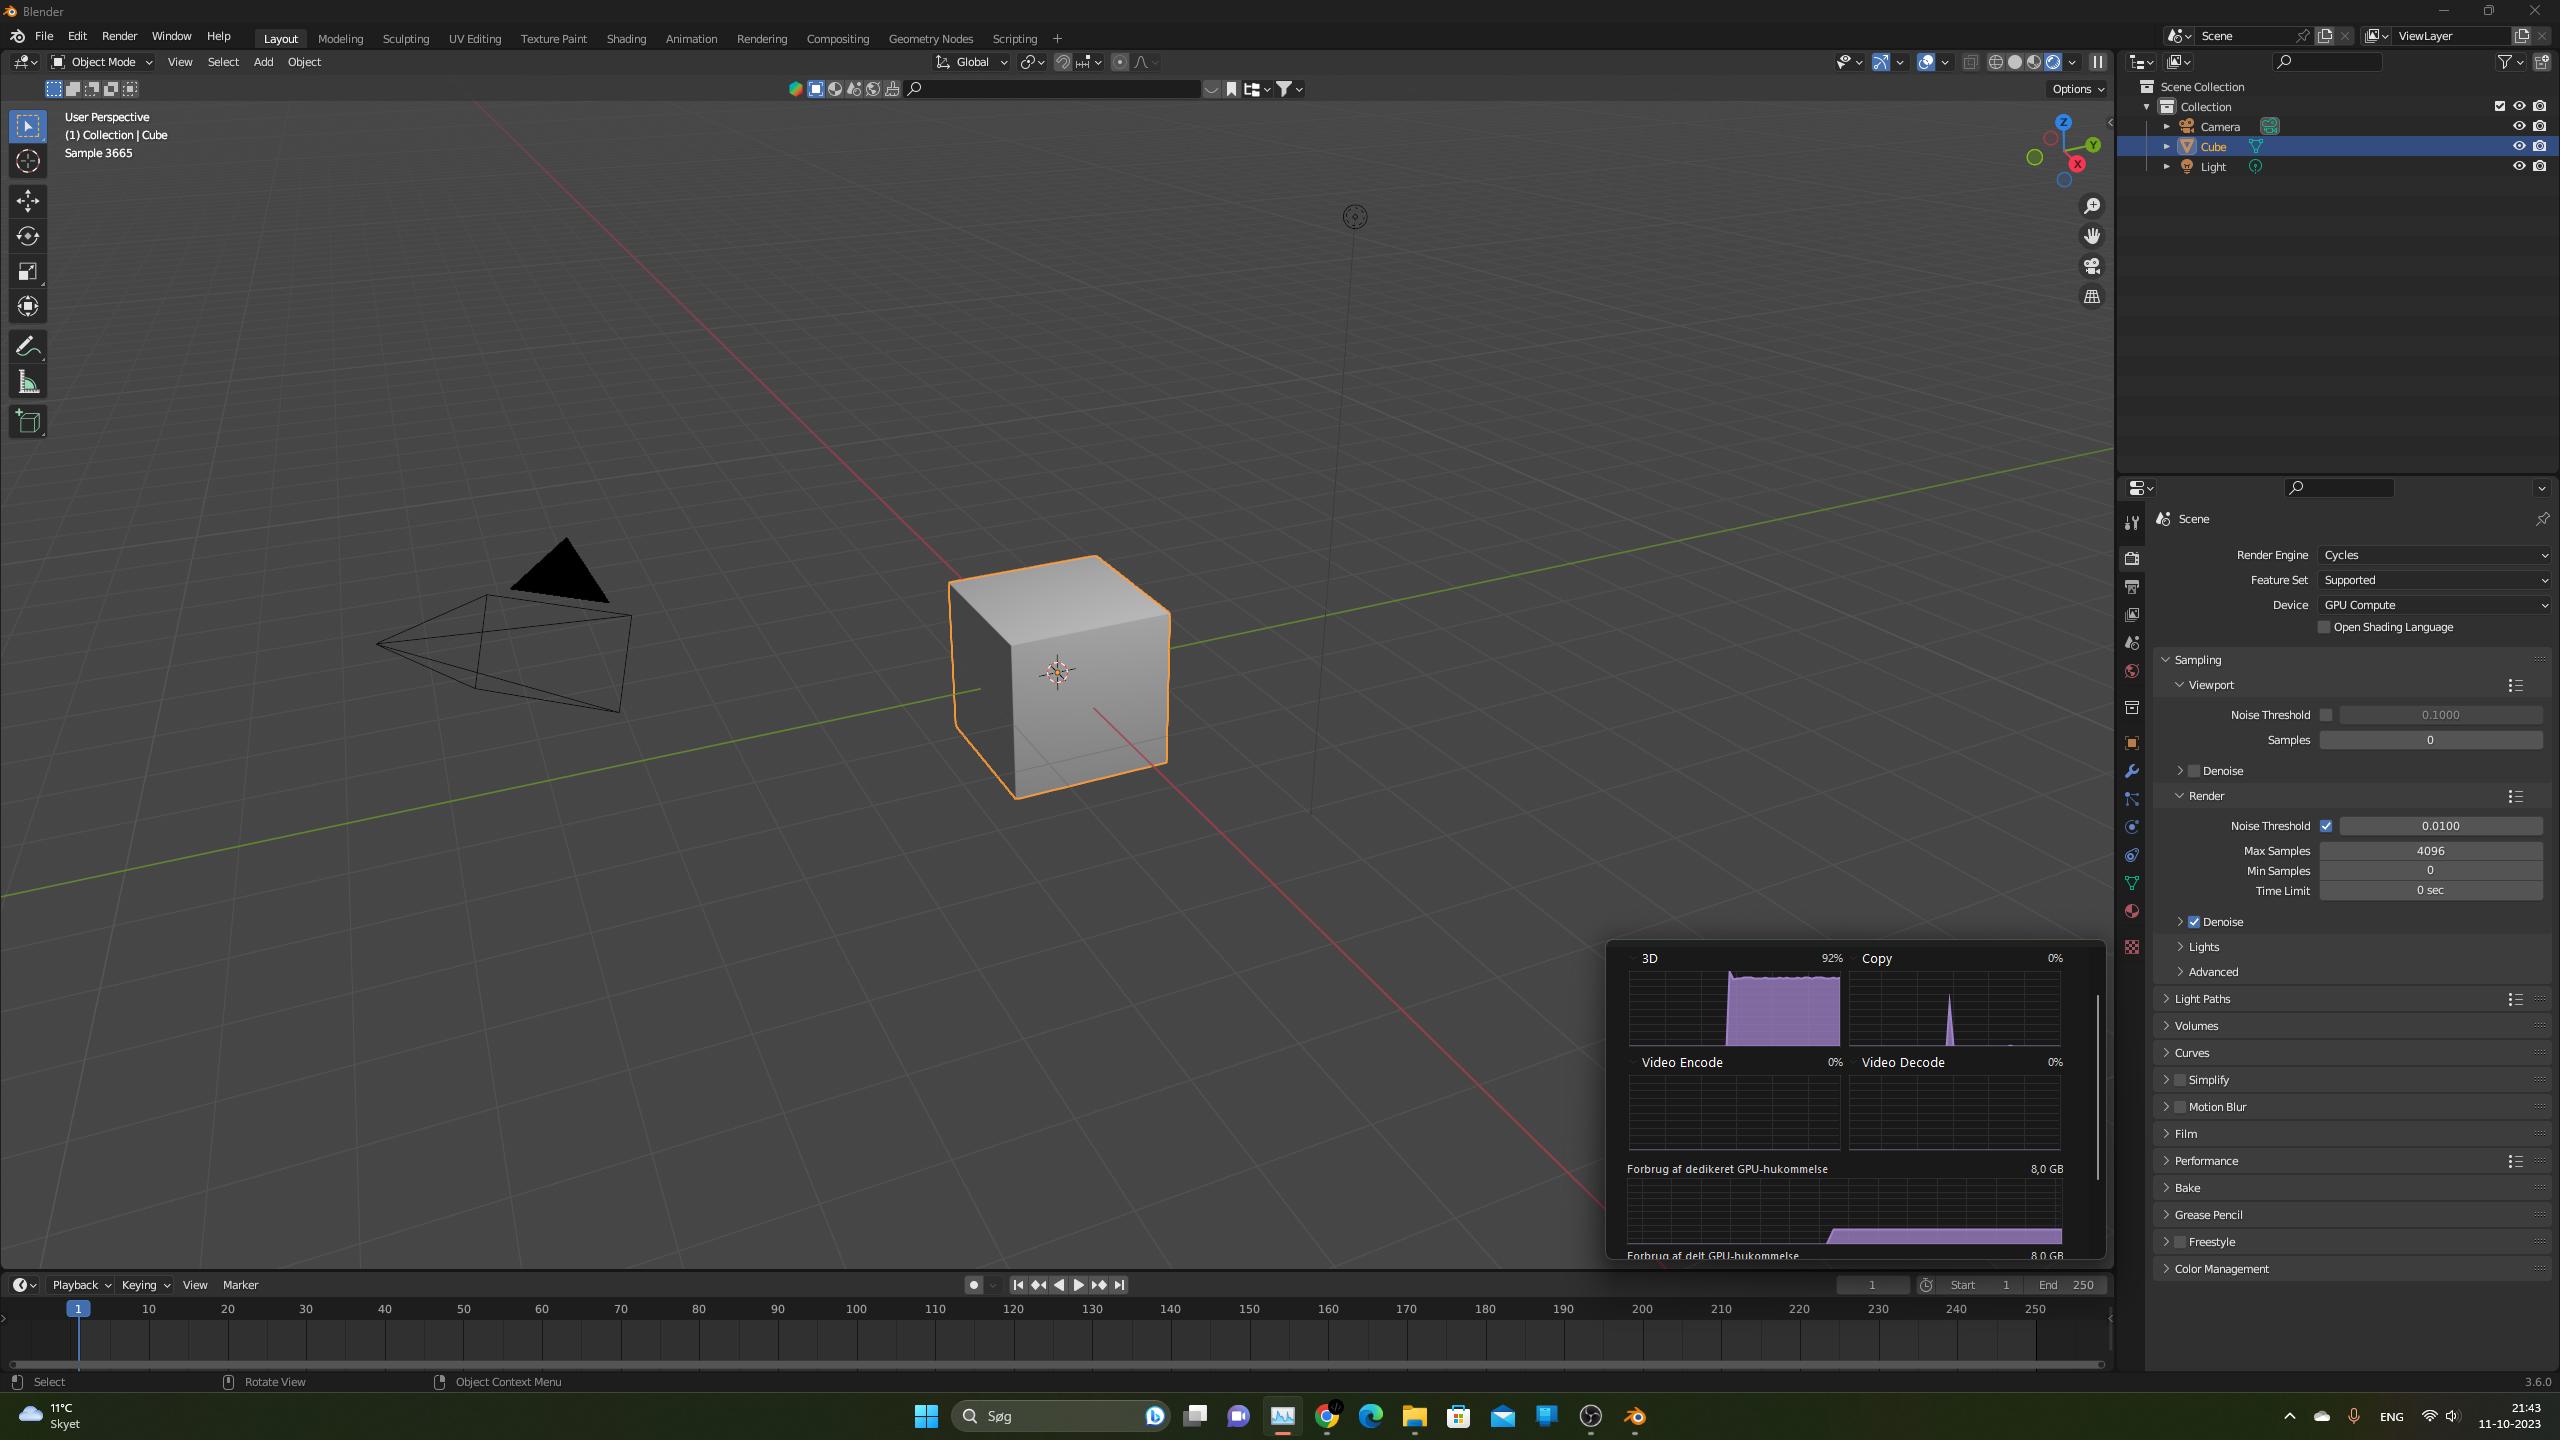
As you can see it's using more than 90% of my gpu in cycles. It has been working fine for the last few weeks. I have experienced no problems until it just suddenly crashed when I went into render view in another scene.

I normally have between 30% and 80% VRAM usage depending on the scene.

In evee, I don't have this problem.

I did nothing but close and open blender in between it working and using too much VRAM.

I have already tried restarting my computer and updating my drivers.

blender version: 3.6

GPU: gtx 1070 (8 GB VRAM)

$\endgroup$
3
  • 1
    $\begingroup$ As we can see in the text overlay, you are still in the process of rendering samples. As long as you are rendering samples, the GPU will use whatever computing power it can to calculate them. For the VRAM, not sure how you can tell how much is too much for the startup scene. Even an empty scene will take "something". $\endgroup$
    – Lauloque
    Commented Oct 11, 2023 at 23:09
  • $\begingroup$ It has never used this much vram before and this is the first time it has ever used over 90% and when i have at least something more in the scene it crashes because it uses 90% for no reason. I know that it should take at least something but it shouldn't be using all of my gpu memory to render a cube and a light. $\endgroup$
    – thomThalas
    Commented Oct 12, 2023 at 7:57
  • $\begingroup$ Your screenshot doesn't show 90% of VRAM usage, it shoes 90% of "3D" computing. Reaching 100% of that shouldn't crash unless of a bug or having multiple independant tasks fighting for the same resource (like two Blender open, or Blender + a game, ... One could "lose" the battle, and the driver kill it because it took too much time to answer because of waiting its turn for computing), but otherwise it should slow down the computing. Same for VRAM, it should either cancel the task with an error in older Blender version, or overflow in your system RAM at the cost of speed. $\endgroup$
    – Lauloque
    Commented Oct 12, 2023 at 15:54

1 Answer 1

4
$\begingroup$

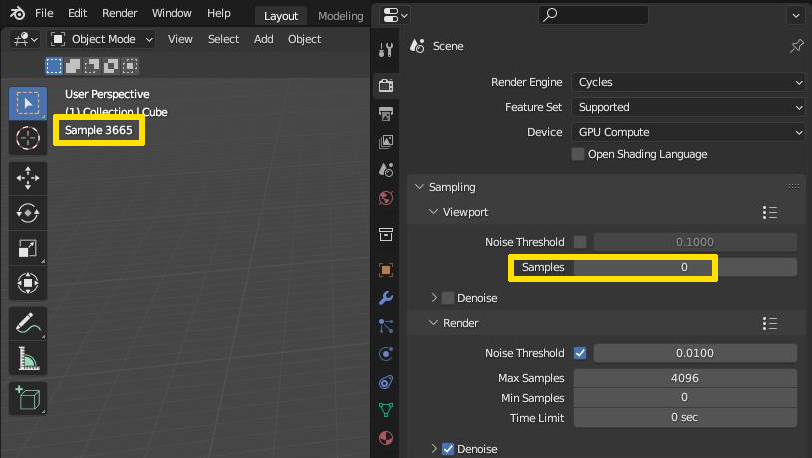
It is as @L0Lock said: "As long as you are rendering samples, the GPU will use whatever power it can to calculate them." You have set the Viewport > Samples to 0, which means Unlimited. Therefore it will never stop rendering as long as you are in Rendered view. The moment you took that screenshot it was at 3665 samples. Wait longer and this number will keep increasing (actually I think at one point it will stop and not render forever, but I don't know when exactly).

viewport samples

$\endgroup$
1
  • $\begingroup$ I'm sorry I haven't realized that this is the case before. I thought that the problem I had with crashing was related to the VRAM usage but I was wrong. But now it seems not to happen anymore since I posted this question. Sorry for wasting your time. $\endgroup$
    – thomThalas
    Commented Oct 12, 2023 at 13:04

You must log in to answer this question.

Not the answer you're looking for? Browse other questions tagged .