2
$\begingroup$

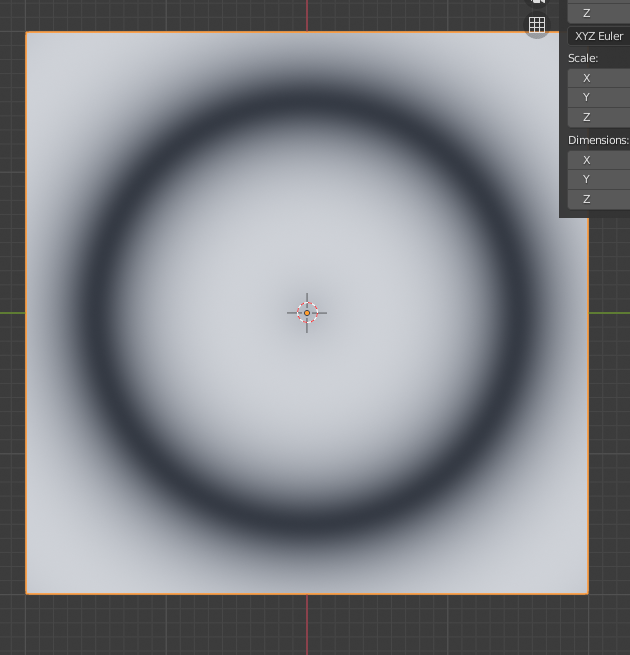
I was just experimenting with a few nodes. I would like to preface I am new to nodes in general. Here is my node setup: enter image description here

Now, my intuition of my node setup is as follows :

For every pixel on the mesh, calculate its length to the center. Passed it to a color ramp. Now it bounded from 0-1 radians, points at the very center have a length of 0, hence are 0, points further out are one, or white. Convert the radian values to degrees Since the values range from 0 to 1, these degree values will range from 0 to 57.3 degrees roughly

Now this is passed into sine (multiply is set to 1 for now, so it doesnt change anything). Here is what I think SHOULD happen:

Pixels where the distance to the center is 0 should be thus shaded black as sin 0 is 0. Pixels where distance to center is 1 would be somewhat white. Pixels roughly halfway between the edges of the plane and center would be greyish, since that would be 0.5 radians roughly which is approx = sin 30 which would be 1/2.

But that is not what we see happening here. Sure, the very center is black as expected, but rather than seeing the colors range from black at the center to somewhat white at the edges where distance is 1, we it go from 0 to 1 or black to white MULTIPLE times. How does this even happen? Also, why does it abruptly go from black to white, and white to black?

Assuming white is the peak of the sine wave, it would slowly decrease down to black. But here, at the edge of a white ring, it immediately jumps down to black. No smooth gradient

So to sum it up: 1)Why do I see multiple bands of black and white here 2) Why is there no smooth gradient between black and white rings? Is my intuition wrong somewhere?

$\endgroup$
3
  • $\begingroup$ Vector Math in length mode doesn't output a vector. It outputs a scalar - a single value. So passing it to a separate XYZ node to be treated as a vector is going to give you unexpected results - I'm not actually sure how a scalar is treated in a vector input, that's an interesting thing to research... If you want just X distance, then simply separate the Object coordinate and pass the x through Math > Absolute node. $\endgroup$ Commented Jul 15, 2021 at 12:53
  • $\begingroup$ @MarkusvonBroady I believe the same value is applied to all channels. -- D'oh it's right in Gorgious' answer. :p $\endgroup$ Commented Jul 15, 2021 at 13:16
  • $\begingroup$ @AllenSimpson looks like only I didn't know that... $\endgroup$ Commented Jul 15, 2021 at 13:19

3 Answers 3

7
$\begingroup$

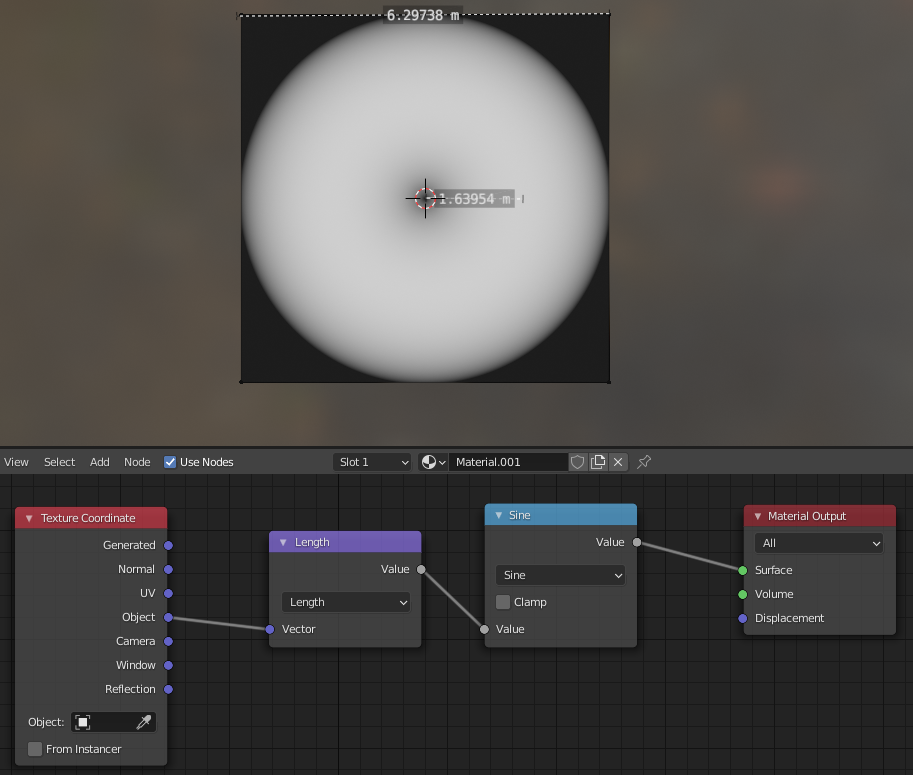
Remember that sine produces output from +1 to -1. The reason you get a sharp falloff to black is that the sine function is outputting negative values, that are just clamped to black.

Also remember that sin takes input in radians. By converting to degrees you're basically multiplying the length by 180/pi, so instead of one wave every 3.14 units, you'll get 60 or so.

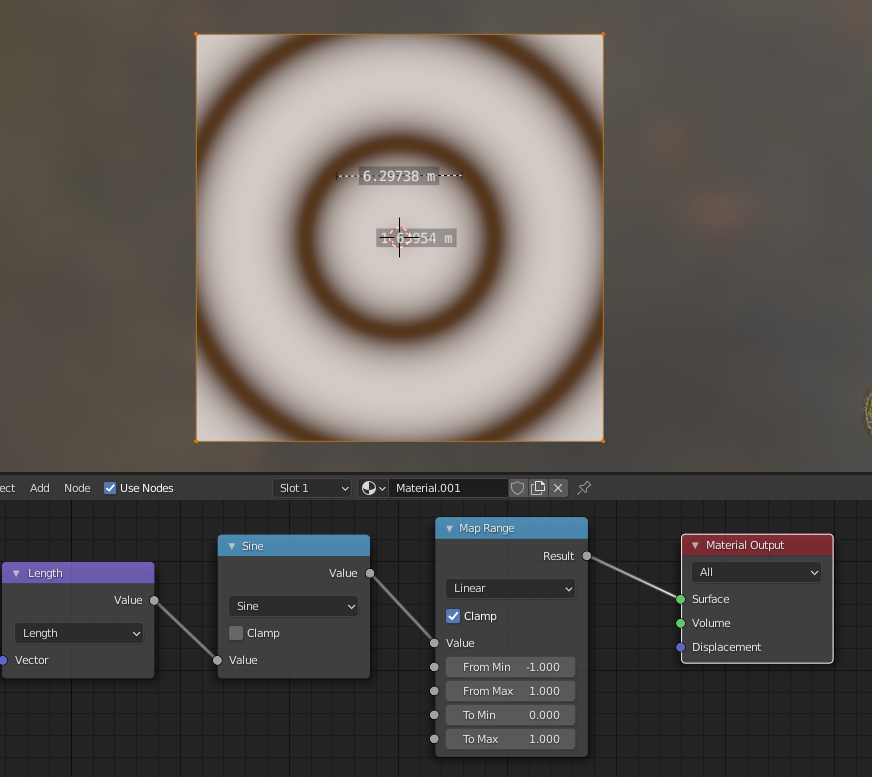
You have a bunch of redundant nodes in your graph too, and some that could be causing problems. You need to find the length, multiply it by pi to get one wave per meter, or whatever frequency you want, feed that into your sine function and then scale the result from -1..+1 to 0..+1

enter image description here

enter image description here

$\endgroup$
1
  • $\begingroup$ So over here, using the map range node, any value below -1 gets treated as 0? Like if I have -0.3, it gets treated as 0? Or does the map node treat it as 0.3 instead? Also if you multiply by 3.14, the length of the vector 1m away from the center is plugged in as pi m. When this is plugged into sin, the value at that point should be black right? But why in your picture, it is white 1m away from the center? $\endgroup$
    – Hash
    Commented Jul 18, 2021 at 11:46
5
$\begingroup$

The Separate XYZ node doesn't have any effect, if you plug a scalar into a vector input, it is automatically converted to (value, value, value).

The problem is that the sine node takes inputs as radians, not degrees. So you don't have to use the math node to convert to degrees. In short : Select the Separate XYZ, Color ramp, To Degrees, and multiply node and press CTRL + X to remove them.

enter image description here

You should also note that negative values are automatically displayed as black, so you won't see anything when the sine goes into negative values. If you want to see what happens, you can for instance remap the value from [-1;1] to [0;1]

enter image description here

$\endgroup$
3
  • $\begingroup$ Nice, good to know I can just connect a scalar instead of connecting the scalar 2 or 3 times to a Combine XYZ node! As for displaying sub-zero values, you can make yourself a utility node group like this: i.imgur.com/UmILpPB.png example: i.imgur.com/ORocSae.png $\endgroup$ Commented Jul 15, 2021 at 13:14
  • $\begingroup$ @MarkusvonBroady Can you describe what you mean by displaying sub zero values? I am not able to understand what the nodes in the picture do $\endgroup$
    – Hash
    Commented Jul 15, 2021 at 17:07
  • 1
    $\begingroup$ @Hash I meant values below 0, e.g. -0.3. When you display a value in Blender, it is mapped to RGB, but since the smallest RGB values are 0, which is black, values below zero are simply clamped to the nearest valid value - to the zero. Because shading often operates on values in -1 ... +1 range, it's important to have tricks like that in your workflow, to clearly see what values you get and differentiate between e.g. -0.3 and -0.5. $\endgroup$ Commented Jul 15, 2021 at 17:19
0
$\begingroup$

The Sine node works on radians. So remove the To Degrees node, and you should get the result you expect.

$\endgroup$

You must log in to answer this question.

Not the answer you're looking for? Browse other questions tagged .